6.3. Spreadsheet Customization Options
In this tutorial we will be covering the various options available to customize your spreadsheets.
Spreadsheet Types
This section details the two different types of spreadsheets that can be created.
Basic Spreadsheet
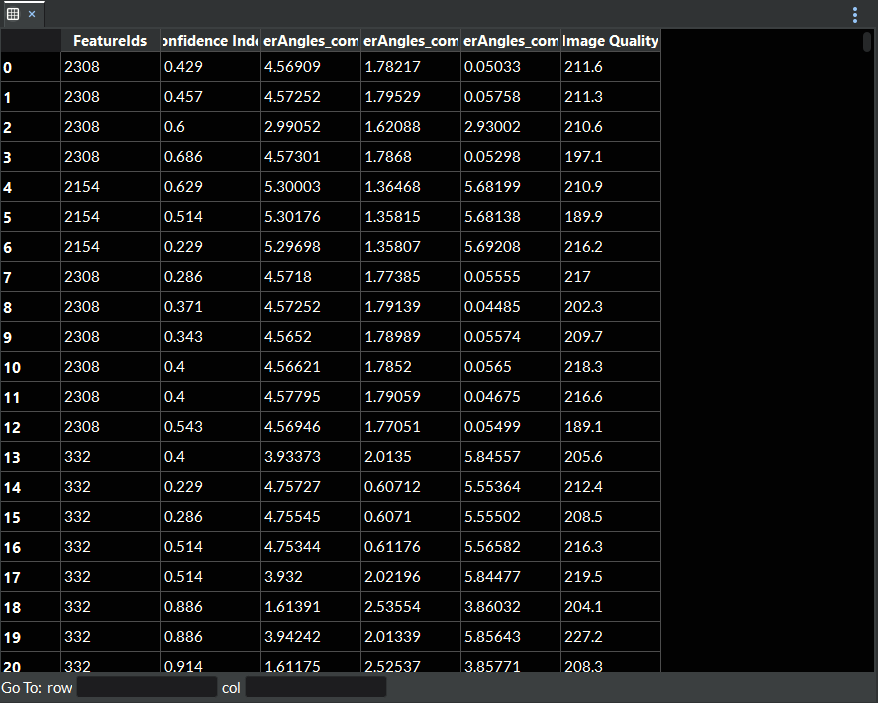
Figure 6.2 Basic Spreadsheet
This spreadsheet type is designed to view one or more data arrays all at once. You can drag and drop as many data arrays as you like from the data structure into the spreadsheet area and each array will be added as a separate column. Arrays that have more than one component will be split up so that each component gets its own column. Data Arrays do not need to have the same number of tuples in order to be added next to each other in the same spreadsheet. You may remove data array(s) from the spreadsheet by clicking on the column(s) of the data arrays you wish to remove, right clicking to access the context menu, and clicking the Remove Selected Column(s) option. You can also clear the entire spreadsheet at once by right clicking and choosing Clear Table.
Multidimensional Spreadsheet
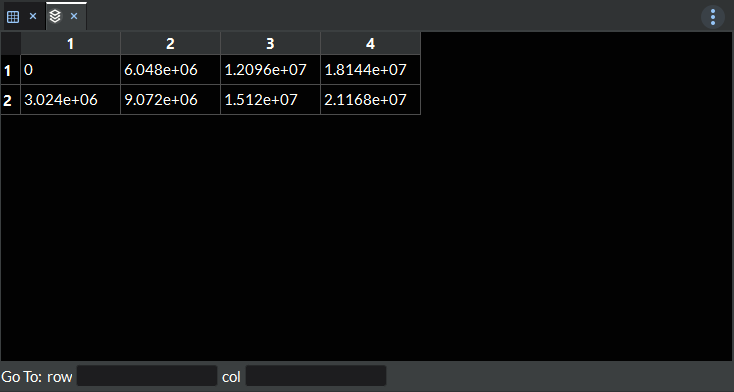
Figure 6.3 Multidimensional Spreadsheet
This spreadsheet type is designed to view a single multidimensional data array at a time. You can drag and drop a single array from the data structure into the spreadsheet area to start your multidimensional view. You can then stride through slices of the data by using the controls in the properties tab along the right hand side.
Data Structure
The data structure tab in the spreadsheet options section along the right hand side of the spreadsheet area allows access to the imported data from a DREAM3D-NX pipeline for displaying in the spreadsheet. The data arrays can be dragged into the spreadsheet area to create the spreadsheet in real time. For more information about how to import data for spreadsheets, please refer to the Importing Data To A Spreadsheet.
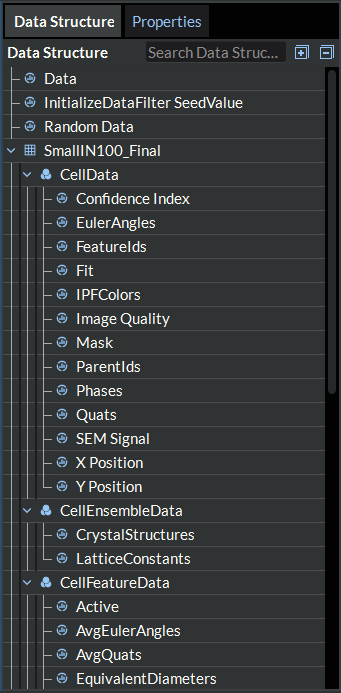
Figure 6.4 DataStructure Tab
Spreadsheet Area Options
There are a couple of different features available directly in the spreadsheet area for moving through and analyzing your data.
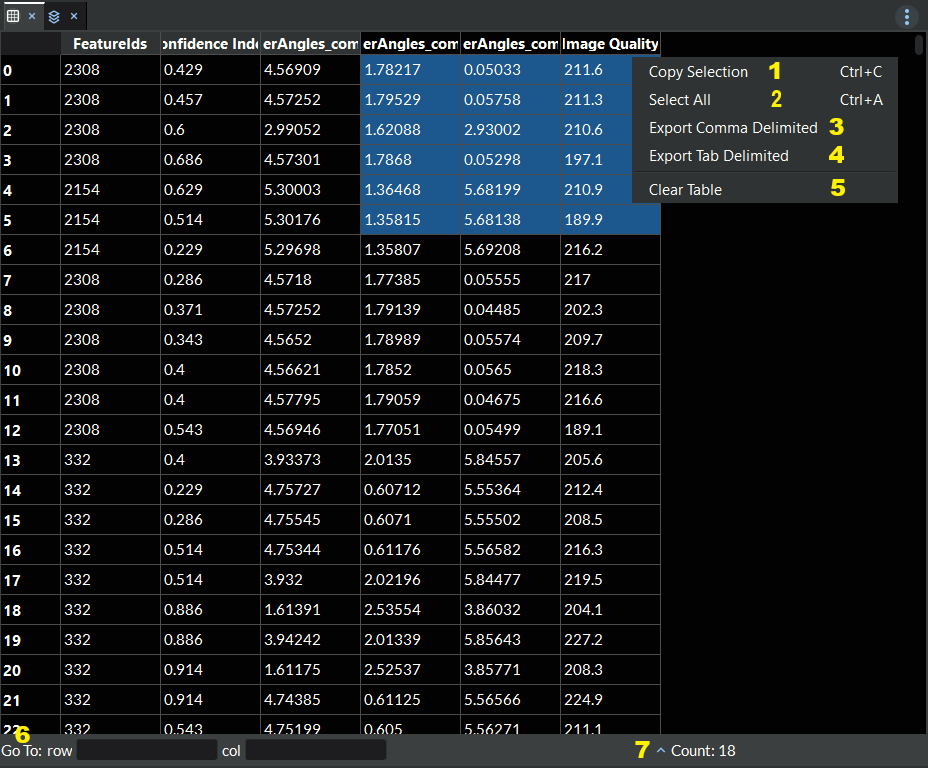
Figure 6.5 Spreadsheet Area Options
Copy Selection : This is an option available from the right click context menu. When selected, this option will copy the selected/highlighted cells to the clipboard.
Select All : This is an option available from the right click context menu. When chosen, this option will select and highlight all the cells in the spreadsheet.
Export Comma Delimited : This is an option available from the right click context menu. When chosen, this will export the entire table to a comma delimeted (csv) file.
Export Tab Delimited : This is an option available from the right click context menu. When chosen, this will export the entire table to a tab delimeted (tsv) file.
Clear Table : This is an option available from the right click context menu. When chosen, this option will clear all the data from the table.
Go To Column/Row : These two input boxes are located in the status bar along the bottom left hand side of the spreadsheet area. They allow you to jump to a particular row and/or column of your data instead of scrolling to it via the mouse wheel or scroll bar. If you enter a number that is greater than the current number of rows/columns, it will automatically jump you to the last row/column instead.
Stats Label : This informational label will appear when you select/highlight two or more cells of the table. It is located in the status bar along the bottom right hand side of the spreadsheet area and displays various statistics about the data in the selected/highlighted cells including count, min, max, sum, and average. You can switch which statistic is displayed by clicking on the arrow next to the label and then choosing the desired statistic.
Column Resizing : You can resize multiple columns to a custom width by selection all the columns you wish to resize and then clicking and dragging one of the selected columns to resize it as normal. The rest of the selected columns will then resize themselves to match the width of the column you just resized.
Properties
The properties tab in the spreadsheet options section along the right hand side of the spreadsheet area allows the user to control various aspects of how to view the data in the spreadsheet. Each option available for the two different types of spreadsheets will be detailed below.
Data Array Path Label This label appears at the top of the Poperties tab for Multidimensional Spreadsheets only. It displays the full path to the data array in the data structure it came from.
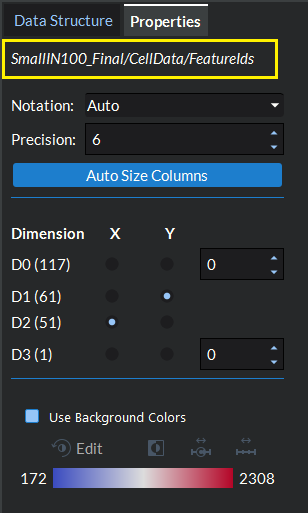
Figure 6.6 Data Array Path Label
Notation This option appears in the properties tab for both types of spreadsheets and allows you to control the notation type of the numbers displayed in the spreadsheet cells. You can choose from Auto, Fixed, or Scientific notation.
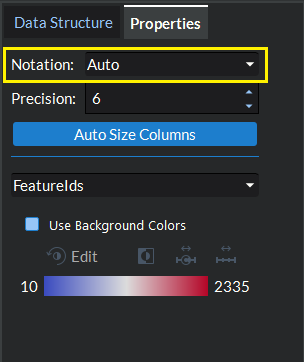
Figure 6.7 Notation Property
Precision This option appears in the properties tab for both types of spreadsheets and allows you to control the precision of the numbers displayed in the spreadsheet cells.
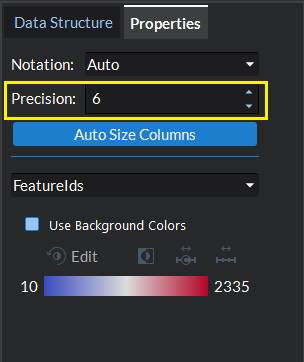
Figure 6.8 Precision Property
Auto Size Columns This option appears in the properties tab for both types of spreadsheets and allows you to automatically resize all columns to the same width according to the best fit for the entire table of data.
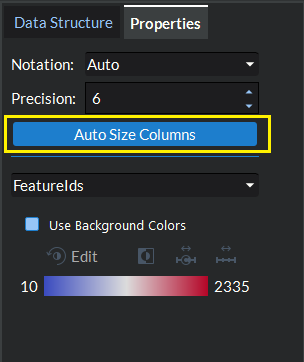
Figure 6.9 Auto Size Columns Property
Dimension Controls This label appears at the top of the Poperties tab for Multidimensional Spreadsheets only. In provides a number of different controls for selecting what slice of data to show in the spreadsheet area table.
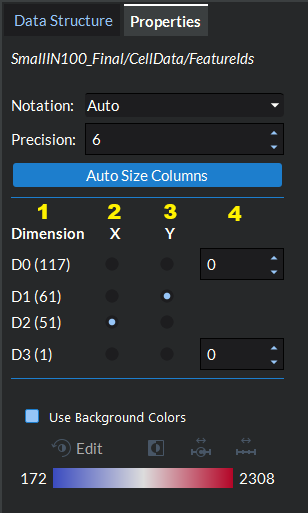
Figure 6.10 Dimension Controls
Dimension Column : This column displays a set of numbered labels for each dimension in the data set along with each dimension’s size in parenthases.
X Column : This column contains a set of radio buttons associated with each dimension in your data set. By selecting the button next to a particular dimension, you can set that dimension as the X axis (or columns) for displaying your data. You may only choose one X dimension at a time and it may not be the same dimnesion as the one you chose for Y.
Y Column : This column contains a set of radio buttons associated with each dimension in your data set. By selecting the button next to a particular dimension, you can set that dimension as the Y axis (or rows) for displaying your data. You may only choose one Y dimension at a time and it may not be the same dimnesion as the one you chose for X.
Number Selection Column : The forth column in the dimension controls table provides an input box for each of the remaining dimensions that are not being used for the X and Y axes. In these input boxes, you will select the index into that dimension to use for striding through and displaying the desired slice of data from your array.
Background Color Options These options appear in the properties tab for both types of spreadsheets. The basic spreadsheets will allow you to color each column independently by first either choosing the column in the drop down array or selecting the column in the table and then editing the color options below. The multidimensional spreadsheets will allow you to color the entire table together with the same set of color options.
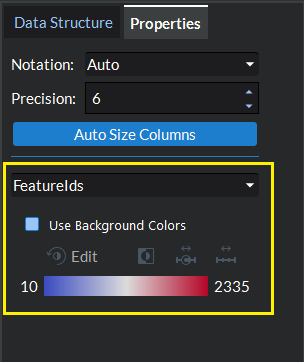
Figure 6.11 Background Colors Property
Highlight Current Column : This allows the user to turn on/off the dotted line highlighting around the current column. WHen turned on, this may help clearly identify which column is being changed when editing the following color options.
Column Diff : When turned on, this option will compare the cells in each row from the two specified columns and highlight in red all the rows where the cells differ. If one of the specified column already has background coloring turned on, the background coloring will be turned off and this option’s coloring will take precedence.
Use Background Colors : This option will turn the background cell colors on/off for the current data array.
Edit Color Preset : The
 Edit button allows you to choose a different color mapping.
Invert : The
 button allows you to invert the color mapping.
Custom Data Range : The
 button allows you to scale the data’s color mapping to a custom user defined range.
Scale to Data Range : The
 button allows you to scale the color mapping to the range found in the data array.
Splitting the view
When creating new spreadsheets, the user has the option to either add the spreadsheet to the current view or split the view by adding the spreadsheet next to or underneath the
current view. You can access this feature by going to the more options menu (  ) in the top right hand corner of the spreadsheet area and go
to the Add Spreadsheet submenu. In the Add Spreadsheet submenu you have the option to add the spreadsheet To This View (which will add a new spreadsheet tab to the current view),
Next To This View (which will create a split view and add a new spreadsheet tab in a view to the right of the current view), or Underneath This View (which will also create a split
view and add a new spreadsheet tab in a view underneath the current view).
) in the top right hand corner of the spreadsheet area and go
to the Add Spreadsheet submenu. In the Add Spreadsheet submenu you have the option to add the spreadsheet To This View (which will add a new spreadsheet tab to the current view),
Next To This View (which will create a split view and add a new spreadsheet tab in a view to the right of the current view), or Underneath This View (which will also create a split
view and add a new spreadsheet tab in a view underneath the current view).
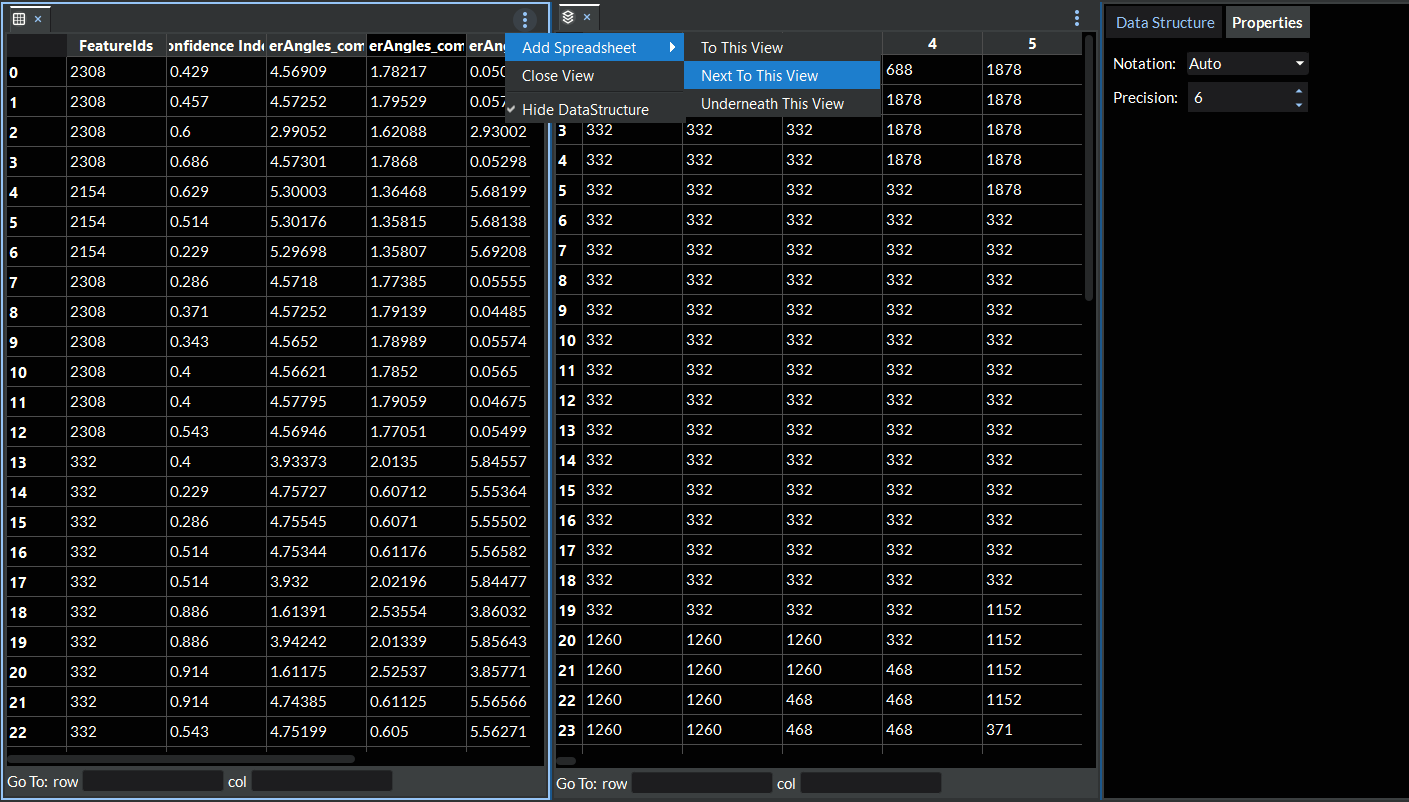
Figure 6.12 Spreadsheet Split View
Once the view has been split one or more times, the user now has the option to move existing spreadsheets between views. To access this feature, either right click on the spreadsheet you want to move or right click on the spreadsheet tab for the spreadsheet you wish to move. This will pull up a context menu where you will find the Move spreadsheet to another view option. When you click on this, it will show a label overlayed onto each of the candidate views that are available for moving the spreadsheet to (see image below).
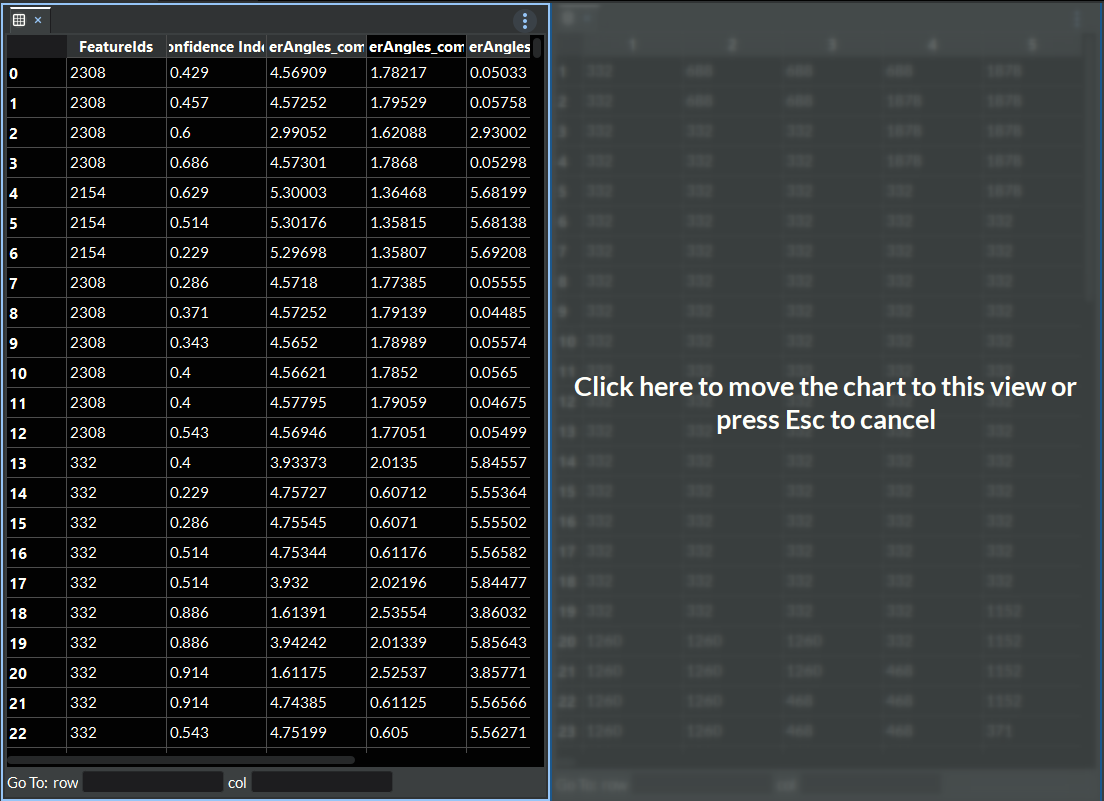
Figure 6.13 Move Spreadsheet