5.3. Chart Customization Options
In this tutorial we will be covering the various options available to customize your chart.
Chart Types
This section contains all the inputs for creating the chart from the imported data structure. You will need to first select your chart type from the available options shown in the chart area (as shown in the image below). From there, you can drag and drop your data arrays from the data structure to the appropriate input fields in the chart types input area and customize the each data series as needed for adding to the chart. Each chart type option will use some combination of the following three input sections.
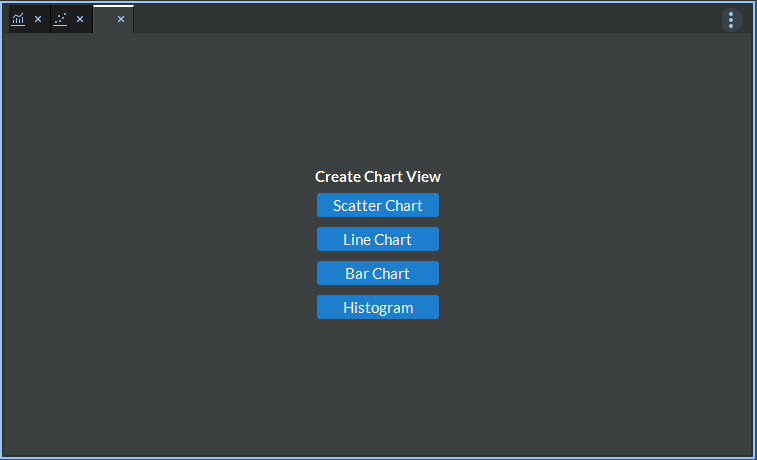
Figure 5.2 Chart Type Selector
x axis array : This section is used to drag and drop the array from the data structure to be used as the x axis values (or labels if desired for certain chart types) in the chart. You can use multi component arrays here by selecting the appropriate component in the drop down component selection box to the right. This array must match the size of all y axis arrays in order to create the chart.
y axis arrays : Drag and drop one or more arrays from the data structure to use for the y axis/each plot series in the chart. Each array in this list must be the same size as well as the same size as the array specified in the x axis array (if it is used). To customize the plot series data for each array, select the array in the list and that array’s components will populate in the component selection table (3) to the right of the list where each component can be added or removed as its own plot series in the chart.
component selection list : This list displays each component for the selected array in the y axis arrays list to the left (2) available for adding or removing from the chart. The components are listed by index and have a visibility icon to the left for controlling whether that component will be added to the chart as its own plot series or not. To edit the plot series data points for each component/series, select the component in the list and that series’ plot options will show up in the Series Options tab in the Chart Options area to the right.
The following sections will break down how each chart type will use the above input sections to create the chart.
Scatter Chart
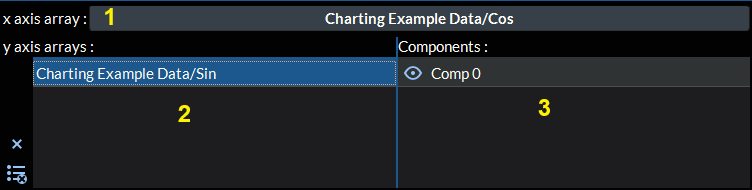
Figure 5.3 Scatter Chart Type Inputs
This chart type will use the x axis array (1) and the y axis arrays (2) to create a scatter plot with each y axis array’s component (3) as a separate point plot series. This chart type provides options to edit the series name, series color, point marker, point size, line style, and line thickness.
Line Chart
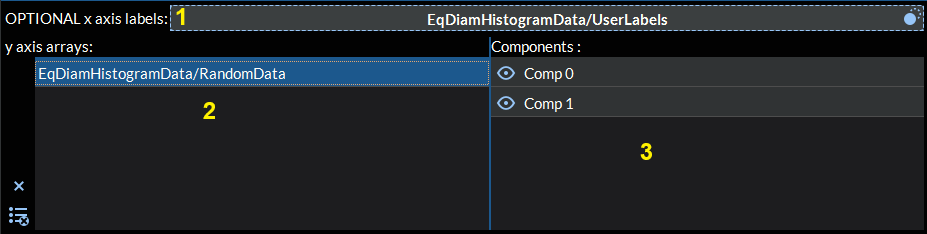
Figure 5.4 Line Chart Type Inputs
This chart type will use the y axis arrays (2) to create a line (or category) plot. Each y axis array’s component (3) will be a separate line plot series and the x axis (or categories) are the arrays’ index values. If the the optional x axis labels array (1) is provided, the array’s values will be used to label the x axis. This chart type provides options to edit the series name, series color, point marker, point size, line style, and line thickness.
Bar Chart
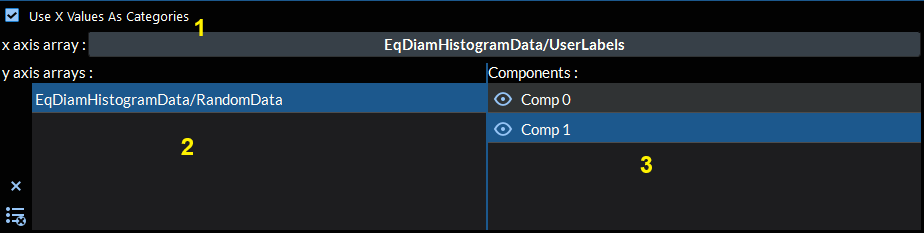
Figure 5.5 Bar Chart Type Inputs
This chart type will use the x axis array (1) and the y axis arrays (2) to create a bar chart with each y axis array’s component (3) as a separate bar plot series. If the Use X Values As Categories checkbox is checked, the array entered in the x axis array input (1) will be used as the x axis labels only and the x axis values will instead be the array index values. This chart type provides options to edit the series name and series color.
Histogram
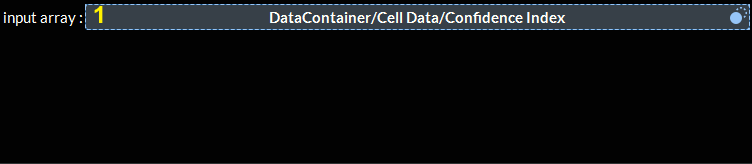
Figure 5.6 Histogram Chart Type Inputs
This chart type will use the input array (1), the bin count, and optionally the custom bin range provided from the plot series options to create a histogram. This chart also provides options to edit the series name and color. This chart option will automatically calculate the necessary histogram values from the input array. If you have pre calculated histogram arrays, you should use the bar chart option instead.
Data Structure
The data structure tab in the chart options section along the right hand side of the chart area allows access to the imported data from a DREAM3D-NX pipeline for displaying in the chart. The data arrays can be dragged into the appropriate input fields in the chart types section along the bottom to create the chart in real time. For more information about how to import data for charting, please refer to the Importing Data To Chart.
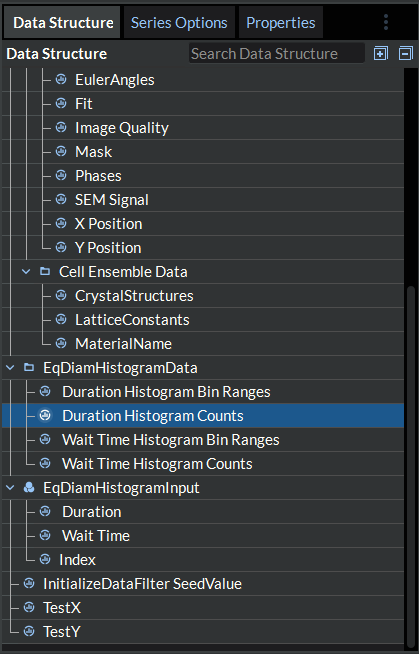
Figure 5.7 DataStructure Tab
Series Options
This tab provides options specific to the chart type that allow you to customize each series of data in the graph. Each chart type provides a different set of options for customizing a series (see the Chart Types section above for more details on what these are). To access these options for a specific series, select the appropriate series from the component list in the chart type inputs area. This should automatically pull up the series options tab with that series’ inputs displayed. The image below provides an example of the series options tab for a selected scatter chart series.
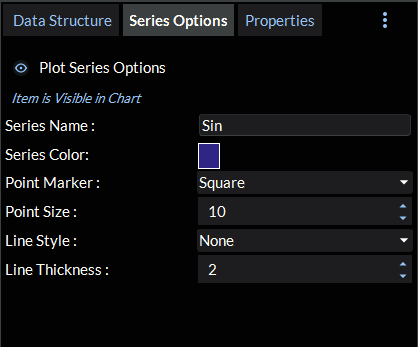
Figure 5.8 Example of scatter plot series options
Properties
Chart / X Axis / Y Axis Title These sections contains all the inputs for creating and customizing the chart and axes titles. On top of editing the title/labels themselves, there are input options for editing the font, font size, font color, and font style (bold or italic) for each title (the chart title, x axis title, and y axis title).
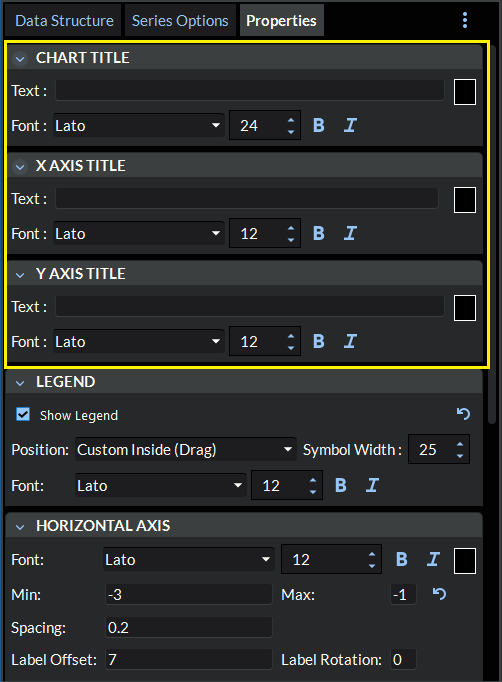
Figure 5.9 Chart Properties Titles
Legend This section contains all the inputs for customizing the look, feel, and positioning of the chart’s legend.
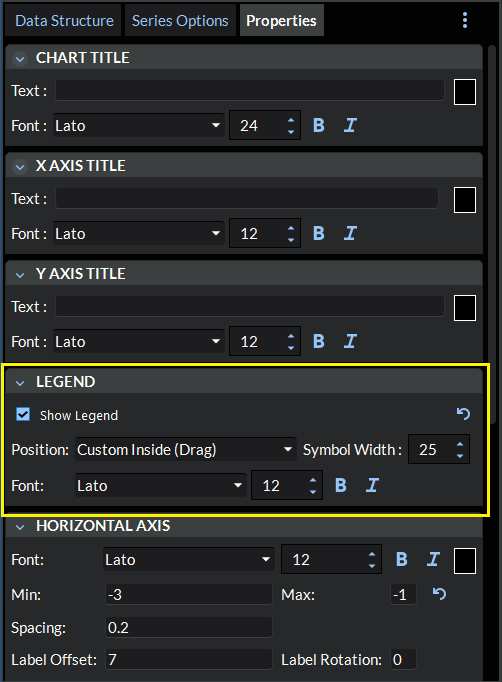
Figure 5.10 Chart Properties Legend
Show Legend : This allows the user to show or hide the legend from the chart.
Reset Legend Position
 : This will reset the current legend’s position to the default position.
Position : This allows the user to customize the positioning of the legend within the chart. There are 8 preset positions to choose from including Top Left, Top Right, Bottom Left, Bottom Right, Top, Bottom, Left, and Right in which the legend will be placed in the corresponding location on the outside of the adjacent plot axis. The 9th option is the Custom Inside (Drag) option in which the legend will be placed on the inside of the plot axes and the user can use the mouse to click and drag the legend to the desired location.
Symbol Width : This allows the user to specify the width of the symbols within the legend.
Legend Font : This allows the user to specify the font for the legend’s text.
Legend Font Size : This allows the user to speficy the font size of the legend’s text.
Legend Font Format : This allows the user to make the legends text bold and/or italic.
Horizontal / Vertical Axes This section contains all the inputs for customizing the look and feel as well as the values and formatting of the axes. These inputs are organized into two sections, one for the horizontal (x) axis and one for the vertical (y) axis. The following list details each of the options available for both of the axes.
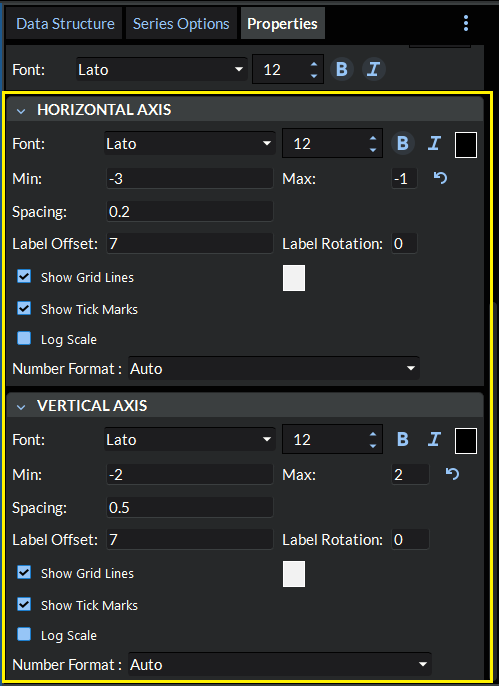
Figure 5.11 Chart Properties Axes
Label Font : Sets the font for the axis tick mark labels.
Label Font Size : Sets the font size for the axis tick mark labels.
Label Font Format : Sets the font format (bold and/or italic) for the axis tick mark labels.
Label Text Color : Sets the text color for the axis tick mark labels.
Axis Range Min : Sets minimum value to display for this axis.
Axis Range Max : Sets maximum value to display for this axis.
Reset Range
: Resets the min and max range values for this axis back to the plot data’s bounds.Spacing : Set the spacing between tick marks for this axis.
Label Offset : The offset of the axis labels from the axis line.
Label Rotation : The rotation in degrees of the axis labels.
Show Grid Lines : Show or hide the grid lines for this axis.
Grid Color : Set the color of the grid lines for this axis.
Show Tick Marks : Show or hide the tick marks for this axis.
Log Scale : Turn on or off log scaling for this axis.
Number Format : Set the number format of the tick labels for this axis. The options are auto (standard) notation, fixed notation, or scientific notation.
Advanced Options
Splitting the view
When creating new charts, the user has the option to either add the chart to the current view or split the view by adding the chart next to or underneath the
current view. You can access this feature one of two ways. You can go to the more options menu (  ) in the top right hand corner of the chart area and go
to the Add Chart submenu. You can also right click on the chart in the chart area to open a context menu and go to the Add Chart submenu from there as well.
In the Add Chart submenu you have the option to add the chart To This View (which will add a new chart tab to the current view), Next To This View (which will
create a split view and add a new chart tab in a view to the right of the current view), or Underneath This View (which will also create a split view and add a new
chart tab in a view underneath the current view).
) in the top right hand corner of the chart area and go
to the Add Chart submenu. You can also right click on the chart in the chart area to open a context menu and go to the Add Chart submenu from there as well.
In the Add Chart submenu you have the option to add the chart To This View (which will add a new chart tab to the current view), Next To This View (which will
create a split view and add a new chart tab in a view to the right of the current view), or Underneath This View (which will also create a split view and add a new
chart tab in a view underneath the current view).
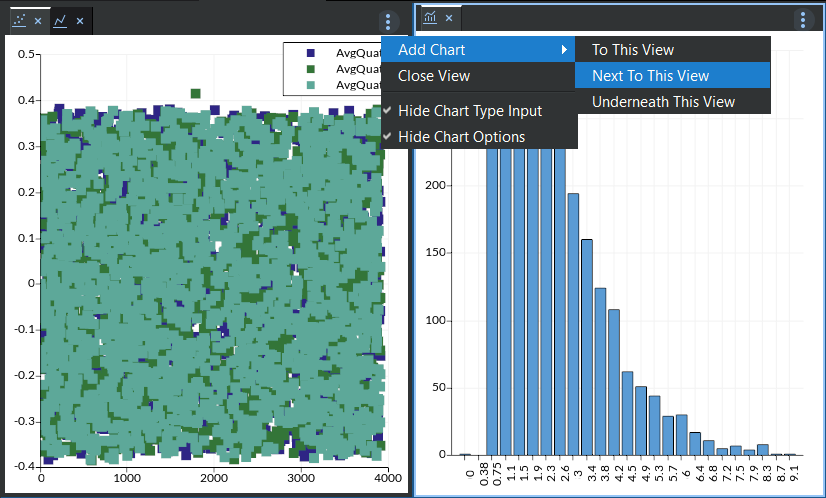
Figure 5.12 Chart Split View
Once the view has been split one or more times, the user now has the option to move existing charts between views. To access this feature, either right click on the chart you want to move or right click on the chart tab for the chart you wish to move. This will pull up a context menu where you will find the Move chart to another view option. When you click on this, it will show a label overlayed onto each of the candidate views that are available for moving the chart to (see image below).
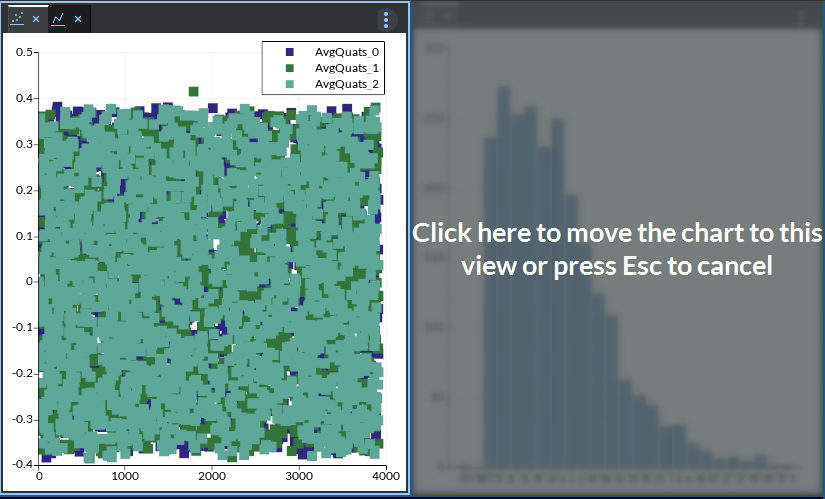
Figure 5.13 Move Chart
Settings Options
Figure 5.14 Chart Settings Menu
Change Default Settings :
This submenu allows the user to modify the stored default values that are applied to new charts. You may save separate default values for the series options of each of the four chart types and a single set of default values for all chart properties (regardless of the chart type). The submenu contains two actions:
To Current Settings… : Saves the settings currently shown in the active tab as the new default values. To use this, navigate to either the Series Options tab or the Properties tab, configure the options as desired, then go to the more options menu (
) in the top right hand corner, expand Change Default Settings,
and click To Current Settings…. Confirm the dialog that appears to save your changes.To Application Defaults… : Resets the stored default values for the active tab back to the application’s built-in defaults. This does not change the current chart’s displayed settings — it only resets what will be used the next time a new chart is created. Confirm the dialog that appears to apply the reset.
Copy/Paste Settings :
This allows the user to copy and paste settings between charts. You may copy and paste settings between charts for the series options of each of
the four chart types as well as the chart properties. When copying/pasting settings between charts of different types, only the settings that both charts have in common will be pasted.
To access this option simply find the chart and options tab you wish to copy/paste, then go to the more options menu ( ) in the top right hand corner and click either the
Copy Settings or Paste Settings option.
Reset Current Settings :
This submenu allows the user to reset the settings currently displayed in the active tab without modifying the stored defaults. This is useful for undoing manual edits and restoring a known-good configuration. The submenu contains two actions:
To User Defaults : Reloads the user’s previously saved default values for the active tab, reverting any unsaved changes made since those defaults were last saved.
To Application Defaults : Resets the currently displayed settings for the active tab to the application’s built-in defaults, regardless of any user defaults that may be stored.