5.4. Exporting Chart Data
In this section we will go over how to export data from the Charting Toolkit.
There three ways to export your chart data from the Charting Toolkit; saved to an image file, saved to a csv file, and copied to the clipboard. The following sections will detail these two options.
Exporting to an Image File
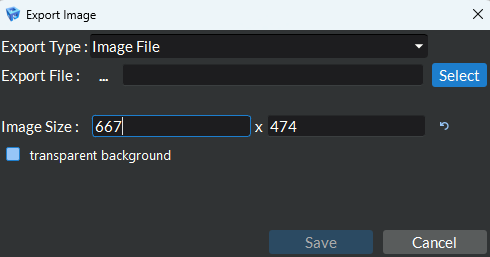
Figure 5.15 Export Image File Tab
Find the chart you wish to export and right click in the chart area to open a context menu and select Export Chart.
In the dialog that pops up (see image above), set the Export Type to Image File.
Set the file name in the Export File field.
Set the image size in the Image Size fields. If you want to keep the chart’s current window size, click the reset button (
 ) to the right of the Image Size fields.
Optionally, set whether or not you would like the chart background to be transparent or not by checking (or un checking) the tranparent background checkbox.
Click the Save button to save the chart to the file.
Exporting to a CSV File
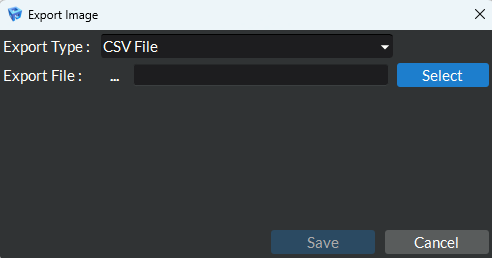
Figure 5.16 Export CSV File Tab
Find the chart you wish to export and right click in the chart area to open a context menu and select Export Chart.
In the dialog that pops up (see image above), set the Export Type to CSV File.
Set the file name in the Export File field.
Click the Save button to save the chart’s table data to the CSV file.
Copy to the Clipboard
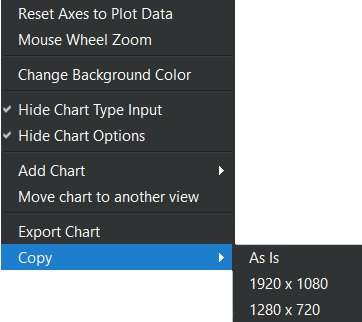
Figure 5.17 Chart Area Context Menu
Find the chart you wish to export and right click in the chart area to open a context menu and find the Copy submenu (see image above).
In the Copy submenu you will find three different size options available for copying the image to the clipboard. Select the desired size option to copy the chart to your clipboard.
Your chart is now copied onto your clipboard and is available for pasting elsewhere.
NOTE: The copy option does not allow for copying the chart with a transparent background.