5.1. Charting User Interface
In this section we introduce you to each component of the DREAM3D-NX user interface that make up the Charting Toolkit.
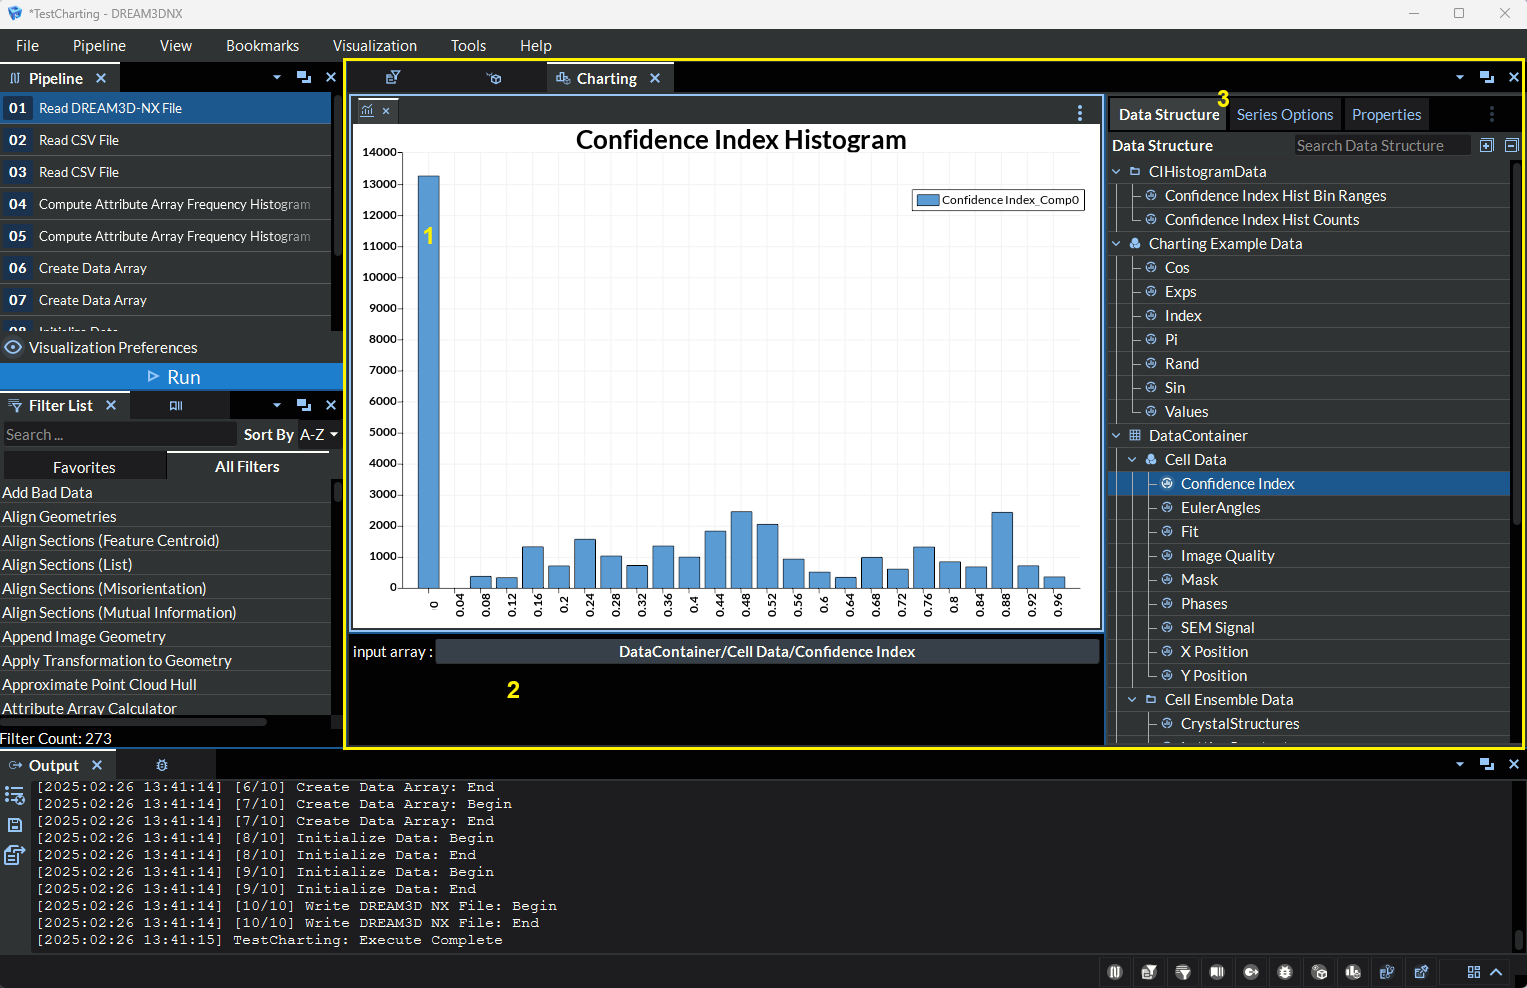
Figure 5.1 Charting View
Chart Area: The chart area is an integral component of the charting interface, displaying the rendered chart and providing direct mouse interaction. The following controls are available:
Action
Result
Alt/Option + Scroll Wheel
Zoom in or out, centered on the cursor position.
Left-button Drag
Pan the chart.
Double-click
Reset zoom to the default auto-scaled view.
The chart area also provides a context menu with additional options for manipulating the chart.
Chart Type Inputs: The chart type inputs along the bottom of the chart area provides the controls for selecting what data will be used in the chart based on the selected chart type. For more information about the input options available for selecting the chart data, please refer to the Chart Types section of the Chart Customization Options.
Chart Options: The chart options along the right hand side of the charting view provides a number of different tabs for accessing the data available to be added to the chart, and options for controlling the look and feel of the chart.