7.1. Quad View User Interface
In this section we introduce you to each component of the DREAM3D-NX user interface that makes up the Quad View module.
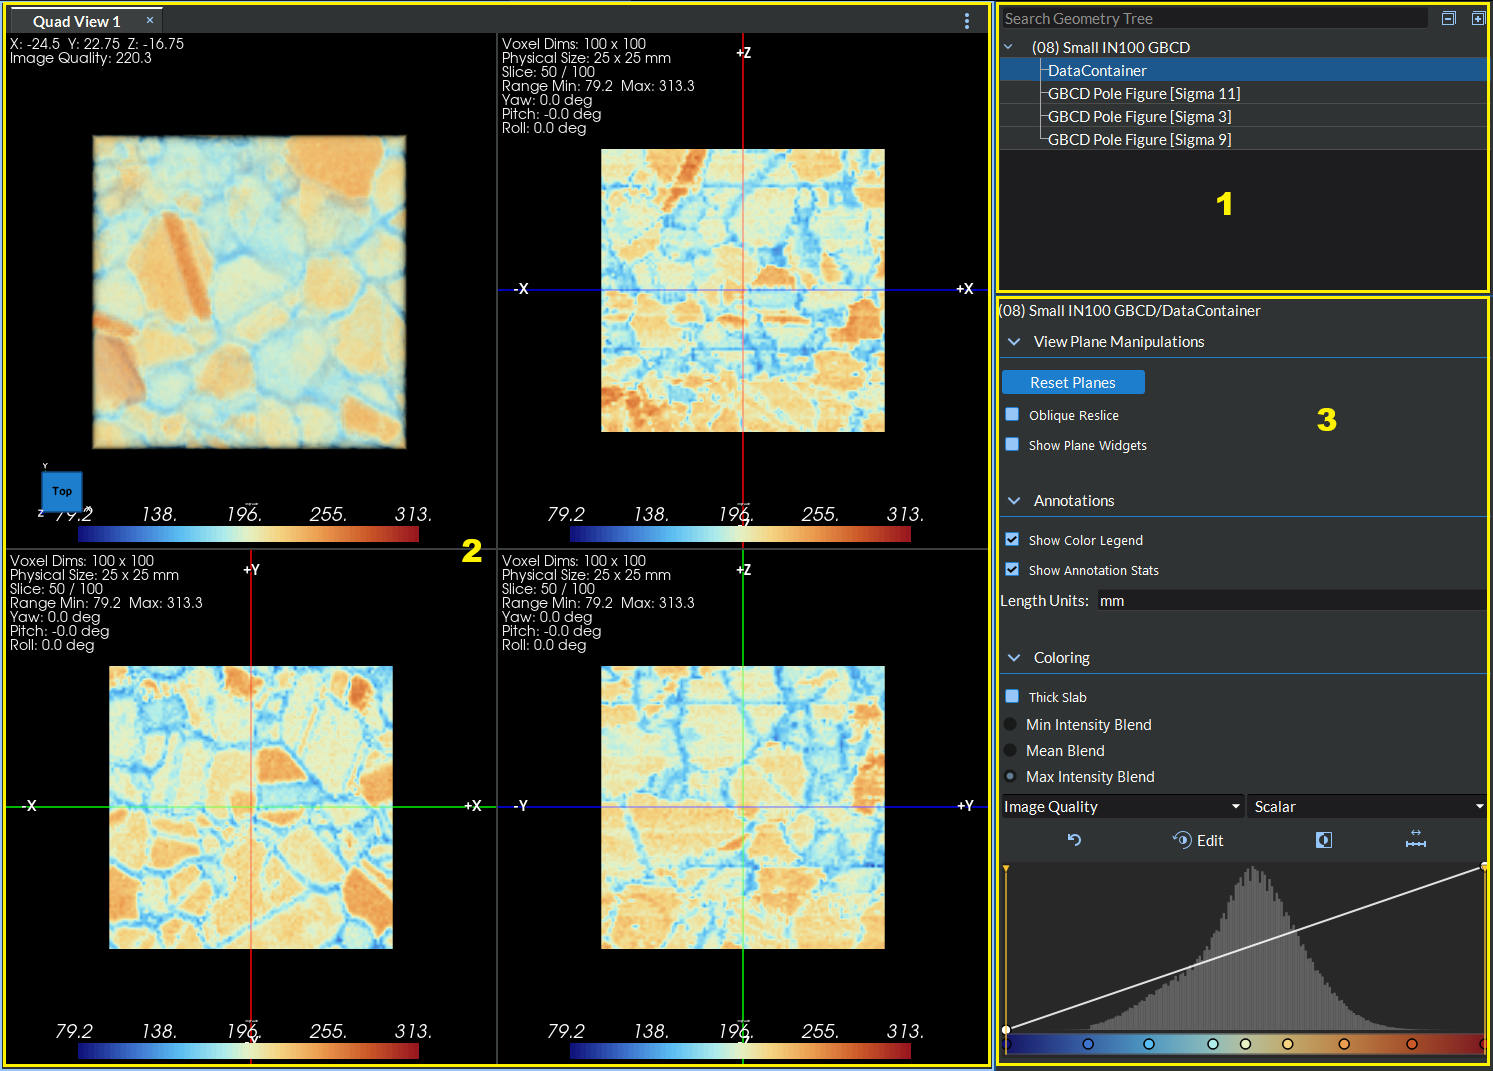
Figure 7.1 Quad View Overview
Opening the Quad View
The Quad View module is shown in its own dock widget. Its visibility can be toggled in two ways:
From the application View menu, toggle the Quad View entry on or off.
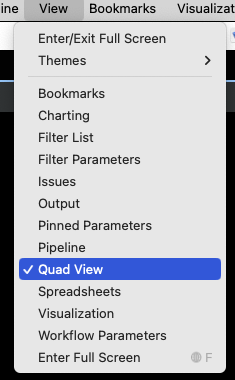
Figure 7.2 The Quad View dock toggle in the application View menu.
Press Ctrl+Shift+G (or use the matching entry in the Quick Access menu) to switch to the Quad-View-Only layout, which hides the other docks and gives the Quad View the full window.
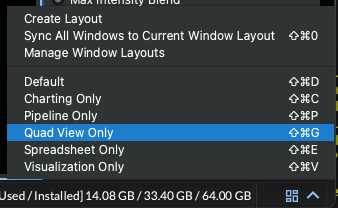
Figure 7.3 The Quad-View-Only layout entry and its keyboard shortcut.
The Quad View module is divided into three main areas: the Geometry Browser on the left, the four-window view area in the center, and the Controls Panel on the right.
Geometry Browser: The Geometry Browser is a tree widget that lists all of the geometry data sources that have been loaded into the Quad View module — either from a completed pipeline run or directly from a
.dream3dfile. Each top-level entry in the tree represents a data source (a pipeline run or a file), and its children represent the individual image geometries available within that source.To display a geometry in the Quad View, drag a geometry leaf node from the browser and drop it onto one of the four view windows of any open Quad View pane. Each Quad View pane displays exactly one geometry at a time; dropping a different geometry on the same pane replaces the current one. To compare multiple geometries side by side, see Displaying Multiple Geometries Side-by-Side.
The toolbar above the browser provides the following controls:
Expand All: Expands all nodes in the tree.
Collapse All: Collapses all nodes in the tree.
Search Bar: Filters the tree to show only nodes whose names match the typed search string.
Right-clicking a node in the tree opens a context menu with options including Load File… (to add a new
.dream3dfile to the browser) and Delete Item and Children (to remove the selected entry from the browser).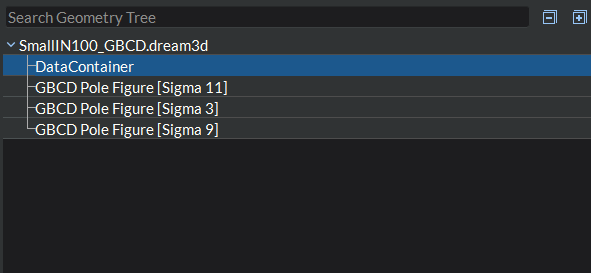
Figure 7.4 Geometry Browser
Four-Window View Area: The central area is divided into four equally-sized windows arranged in a 2×2 grid. Each window shows a different view of the currently loaded geometry:
Window 1 (top-left): Displays a 3D volume rendering of the full dataset. The three orthogonal slice planes currently active in Windows 2–4 are overlaid on the volume so their positions are always visible in context. An orientation widget (view cube) is shown in the corner of this window to indicate the current camera orientation. Interaction with the slice planes from within Window 1 is disabled; the planes can only be repositioned using Windows 2–4.
Window 2 (top-right): Displays a 2D slice of the XZ plane (the plane defined by the X and Z axes). Directional axis labels (e.g. +X, -X, +Z, -Z) track along the crosshair lines to the nearest viewport border, updating in real time as the planes move.
Window 3 (bottom-right): Displays a 2D slice of the YZ plane (the plane defined by the Y and Z axes).
Window 4 (bottom-left): Displays a 2D slice of the XY plane (the plane defined by the X and Y axes).
The two crosshair axis lines visible in each of Windows 2–4 represent the two orthogonal slice planes from the other windows. Interacting with these lines moves the corresponding planes. See Navigating the Views for a full description of how to interact with each window.
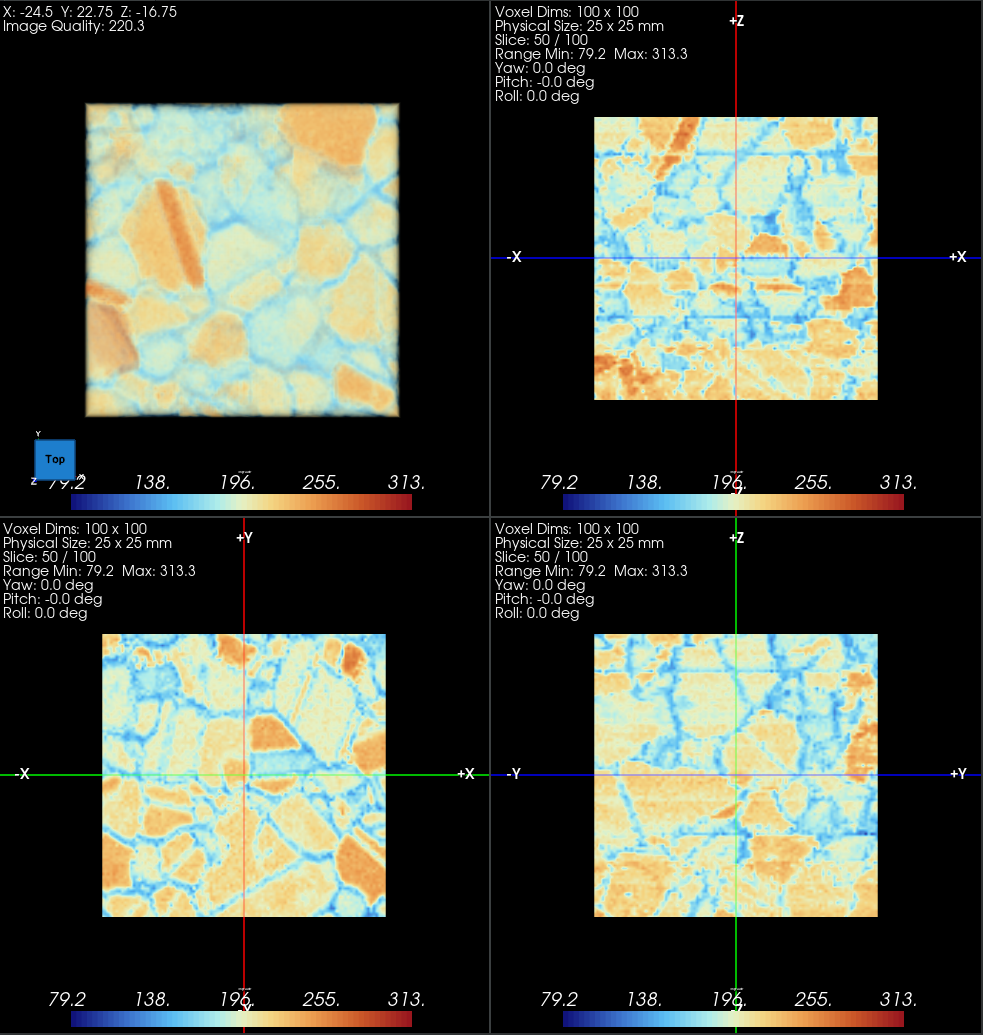
Figure 7.5 Four-Window Layout Showing All Four Views
Controls Panel: The Controls Panel is docked on the right side of the Quad View module and provides a set of options for configuring the appearance and behavior of the active geometry. The panel is organized into five collapsible sections — View Plane Manipulation, Annotations, Color, Volume Rendering, and Volume Lighting — each with a header that toggles its expanded/collapsed state. Section state is preserved per Quad View pane.
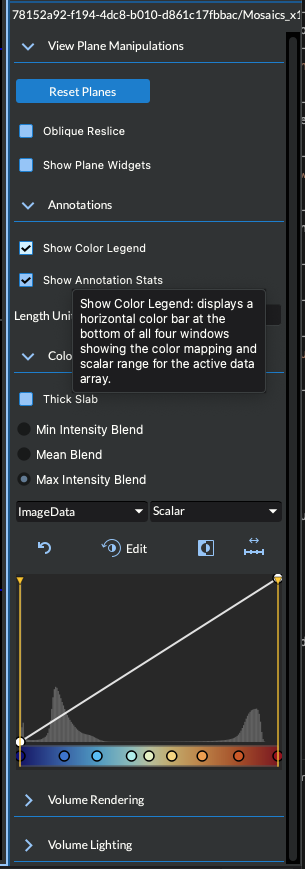
Figure 7.6 The Controls Panel showing the five collapsible groups, with some sections expanded and others collapsed.
The controls appear in the following order from top to bottom:
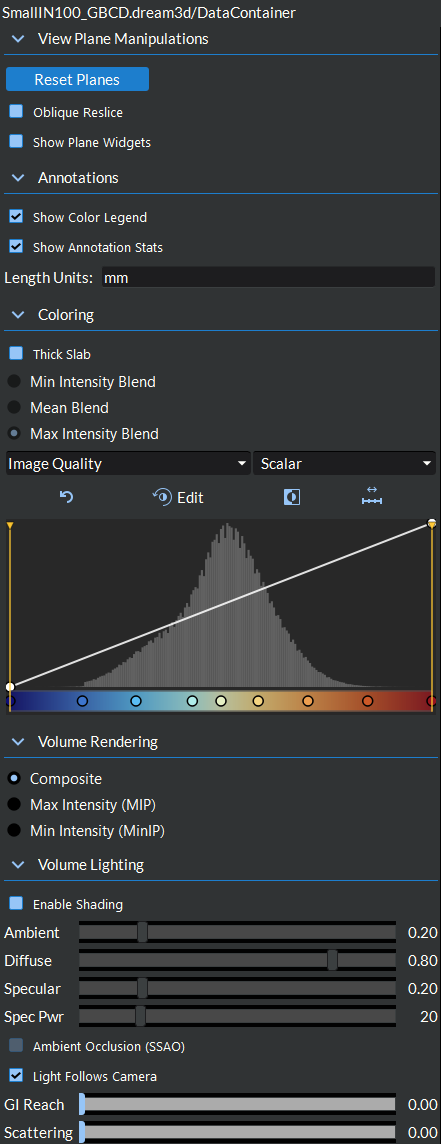
Figure 7.7 Controls Panel
Reset Planes: Resets all three slice planes back to their default axis-aligned positions at the center of the dataset.
Oblique Reslice: A checkbox that switches the slice planes between axis-aligned mode and free-rotation (oblique) mode. See Oblique Reslicing for details.
Show Plane Widgets: A checkbox that toggles the three colored slice plane outlines displayed inside the 3D volume rendering in Window 1. The plane overlays are hidden by default; check this box to display them.
Show Color Legend: A checkbox that toggles the display of a horizontal color scale bar at the bottom of all four windows showing the current color mapping and data range. See Color Mapping Controls for details.
Show Annotation Stats: A checkbox that toggles per-window text overlay statistics in Windows 2–4. See View Annotations for details.
Length Units: A text field that sets the physical unit label used in the dimension annotations across all windows (for example
mm,um, ornm). This value is displayed in the annotation overlays and does not affect any calculations.Thick Slab: A checkbox that enables thick slab projection mode, which renders each slice as a projection through a slab of voxels rather than a single slice plane. When enabled, three blend mode options become available:
Mean Blend: Each pixel displays the average value of all voxels in the slab depth.
Min Intensity Blend: Each pixel displays the minimum value found across the slab depth.
Max Intensity Blend: Each pixel displays the maximum value found across the slab depth.
Array and Component Selectors: Two drop-down menus for selecting which cell data array and which component of that array are displayed across all four windows.
Color Preset Toolbar: A row of action buttons for managing the color mapping: reset to defaults, open the transfer function editor, scale the range to the data, and set a custom range.
Opacity and Color Transfer Function Editor: A combined graph showing the data histogram (colored bars), the opacity transfer function (an editable diagonal line), and the active color map bar below the graph. Control points on the opacity line can be dragged to adjust how opacity is mapped across the data range. The ? button above the graph opens its navigation help. Use Alt/Option + scroll wheel to zoom around the pointer (a plain wheel continues to scroll the Controls Panel), or use Ctrl/Command+= and Ctrl/Command+- to zoom around the chart center. Drag empty chart space with the left mouse button to pan.
Right-click for Zoom In, Zoom Out, Reset View to Data, Box Zoom Mode, and Reset Min/Max. Press Z to enter Box Zoom (shown by a mode label and crosshair cursor), drag a rectangle, and press Escape to cancel; a successful selection returns to Pan mode automatically.
Editable points and yellow range handles take priority over panning when the pointer is over them. Double-clicking edits or adds control points rather than resetting the chart. Reset View to Data restores navigation zoom/pan, while Reset Min/Max separately restores the editable range handles. See Color Mapping Controls for the complete editing reference.
Volume Rendering: A collapsible section with radio buttons for selecting the 3D volume blend mode (Composite, Max Intensity Projection, or Min Intensity Projection). See Volume Rendering Controls for details.
Volume Lighting: A collapsible section with controls for volume shading (ambient, diffuse, specular, specular power), Screen Space Ambient Occlusion (SSAO), Light Follows Camera, and Global Illumination (GI Reach and Scattering). See Volume Rendering Controls for details.
For more details on loading geometry data into the Quad View, see Importing Data.