4.1. Visualization User Interface
In this section we introduce you to each component of the DREAM3D-NX user interface that make up the Visualization Toolkit.
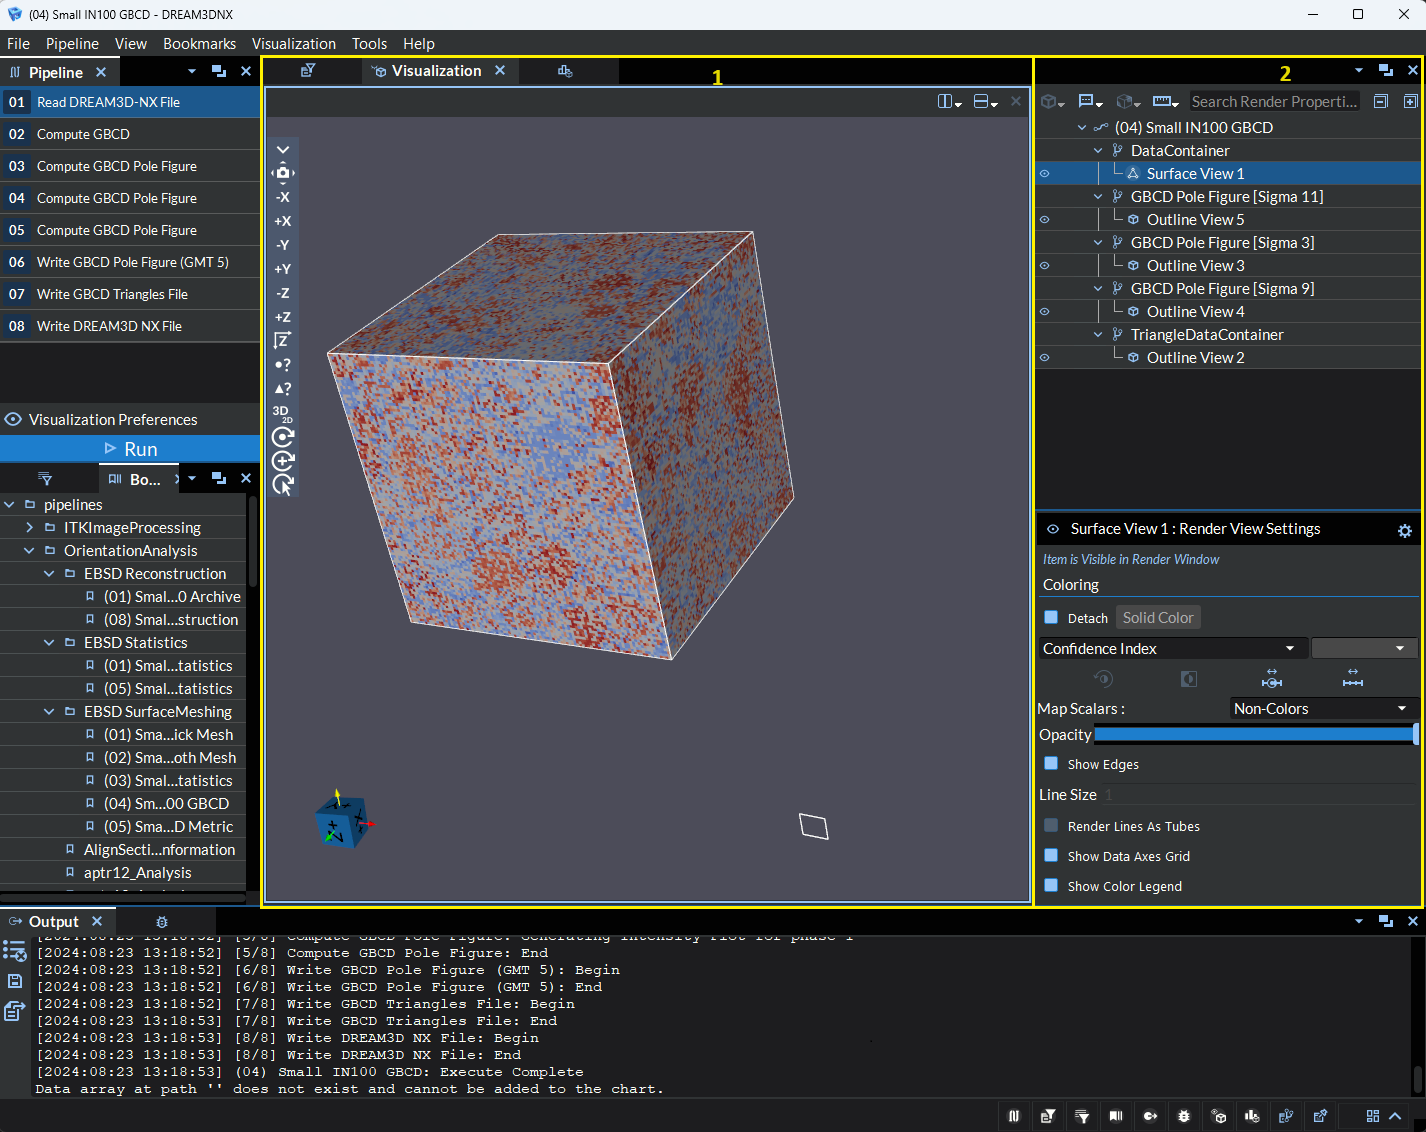
Figure 4.1 Visualization View
The yellow, outlined sections in the above image are considered to be part of the Visualization Toolkit.
Visualization Window: The Visualization window is an integral component of the interface, hosting a VTK render window for real-time data visualization as well as a spreadsheet view for viewing the raw data. The render window is complemented by a toolbar inside the render window along the left hand side, designed to enhance user interaction and control over the visualization. Some of the controls available in the toolbar include:
Snapping the Grid: Enables precise alignment by snapping the grid to the X, Y, or Z axes.
Splitting the VTK Render Window: Facilitates versatile viewing by allowing the VTK render window to be split horizontally or vertically.
Toggling the 3D Visualization Lock: Controls the orientation of the visualized content by toggling the 3D visualization lock.
For a more in-depth exploration of the features and capabilities of the Render Window, please refer to the Render Window Overview.
Render Properties: This section provides a clear and efficient environment for managing, visualizing, and working with imported data. It is divided into two main sections:
Visualization Pipeline Browser: Found at the top of the Render Properties View, the Visualization Pipeline Browser is a tree structure that shows pipelines, geometries, data views, and filters. Geometries are organized as children of pipelines and can host data views and filters. This structure makes it simple for users to apply filters to geometries and choose data views to display original or filtered data in the rendering window.
Above the tree, there’s a toolbar with buttons for specific actions, such as adding filters and data views to the selected tree item or creating global annotations at the top level of the tree.
Visualization Settings: Located below the tree structure in the Visualization Pipeline Browser, the Visualization Settings section changes to show controls and settings relevant to the current tree item selection. For example, selecting a geometry shows coloring options; selecting a representation like “Points” reveals controls such as “Point Size” and “Render Points As Spheres”; selecting a filter like “Slice” displays inputs for the Normal and Origin of the slice. This layout gives users quick access to the right controls for the task at hand.
For more details on how to use the features within the Render Properties View, please see the Render Properties Overview.
For more details on importing geometric data into the Visualization Toolkit, see Importing Data.