4.3. Visualization Views Overview
In this tutorial we will detail all the important features that can be accessed from the Visualization tab.
The main purpose of Visualization tab is to display the geometries in a Render Window or Spreadsheet and provide various tools for interacting with that geometry.
Visualization View Interaction Toolbar
You must have at least one view at all times. (If you wish to remove data from the last view you can do so by right-clicking the items in the Visualization Browser tree and selecting Delete.)
The image below shows all buttons included within the View Interaction group:
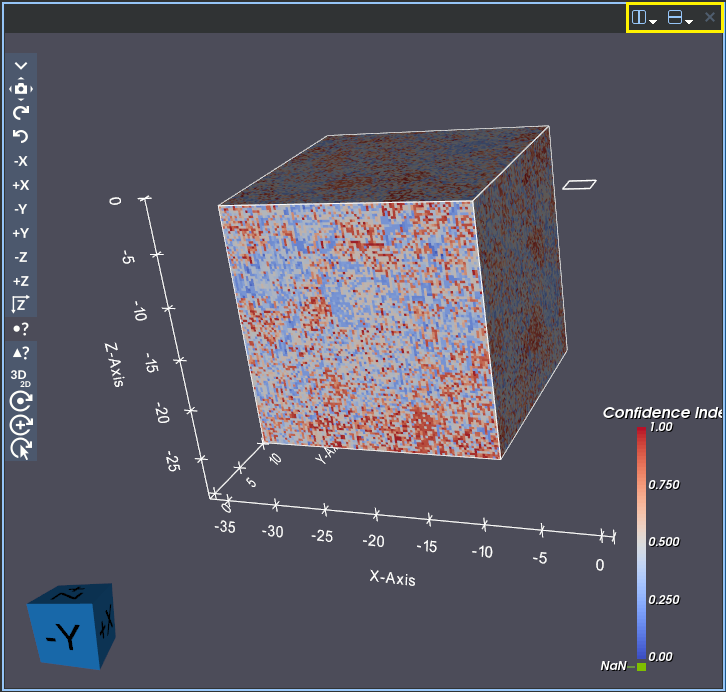
Figure 4.7 Additional Buttons Toolbar
These buttons and their functionality will be detailed below:
Render Window Splitting :
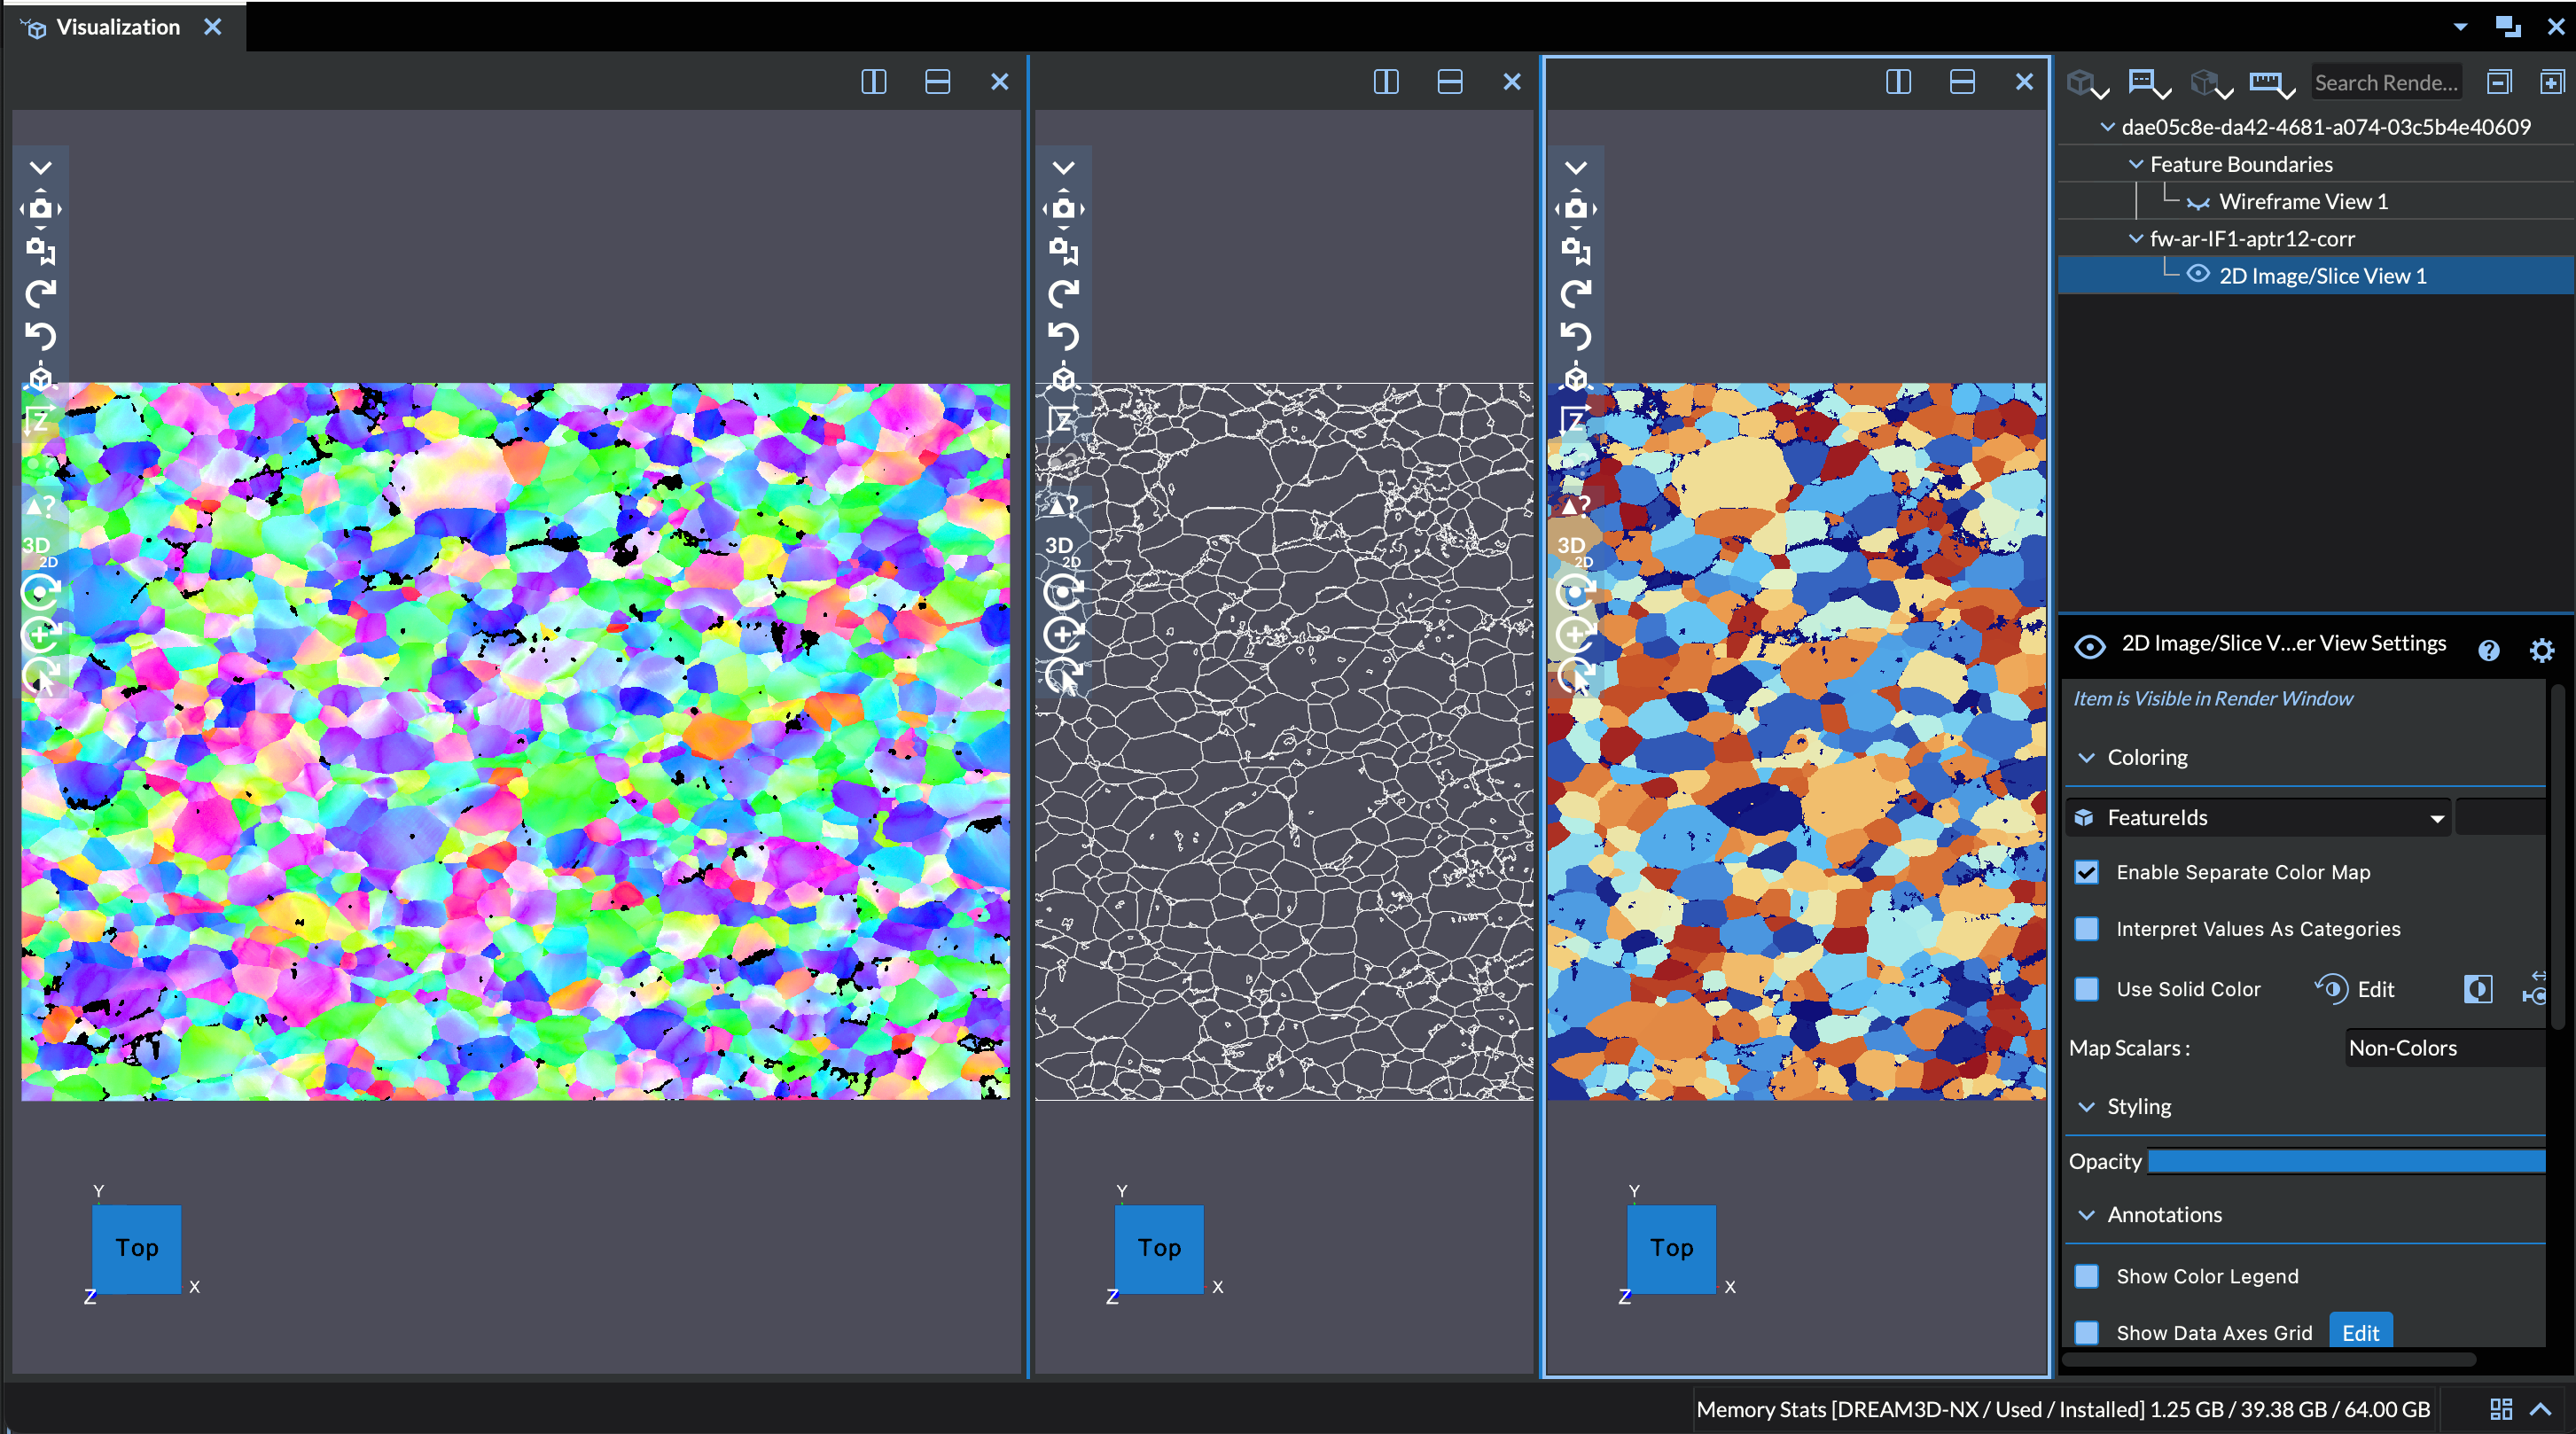
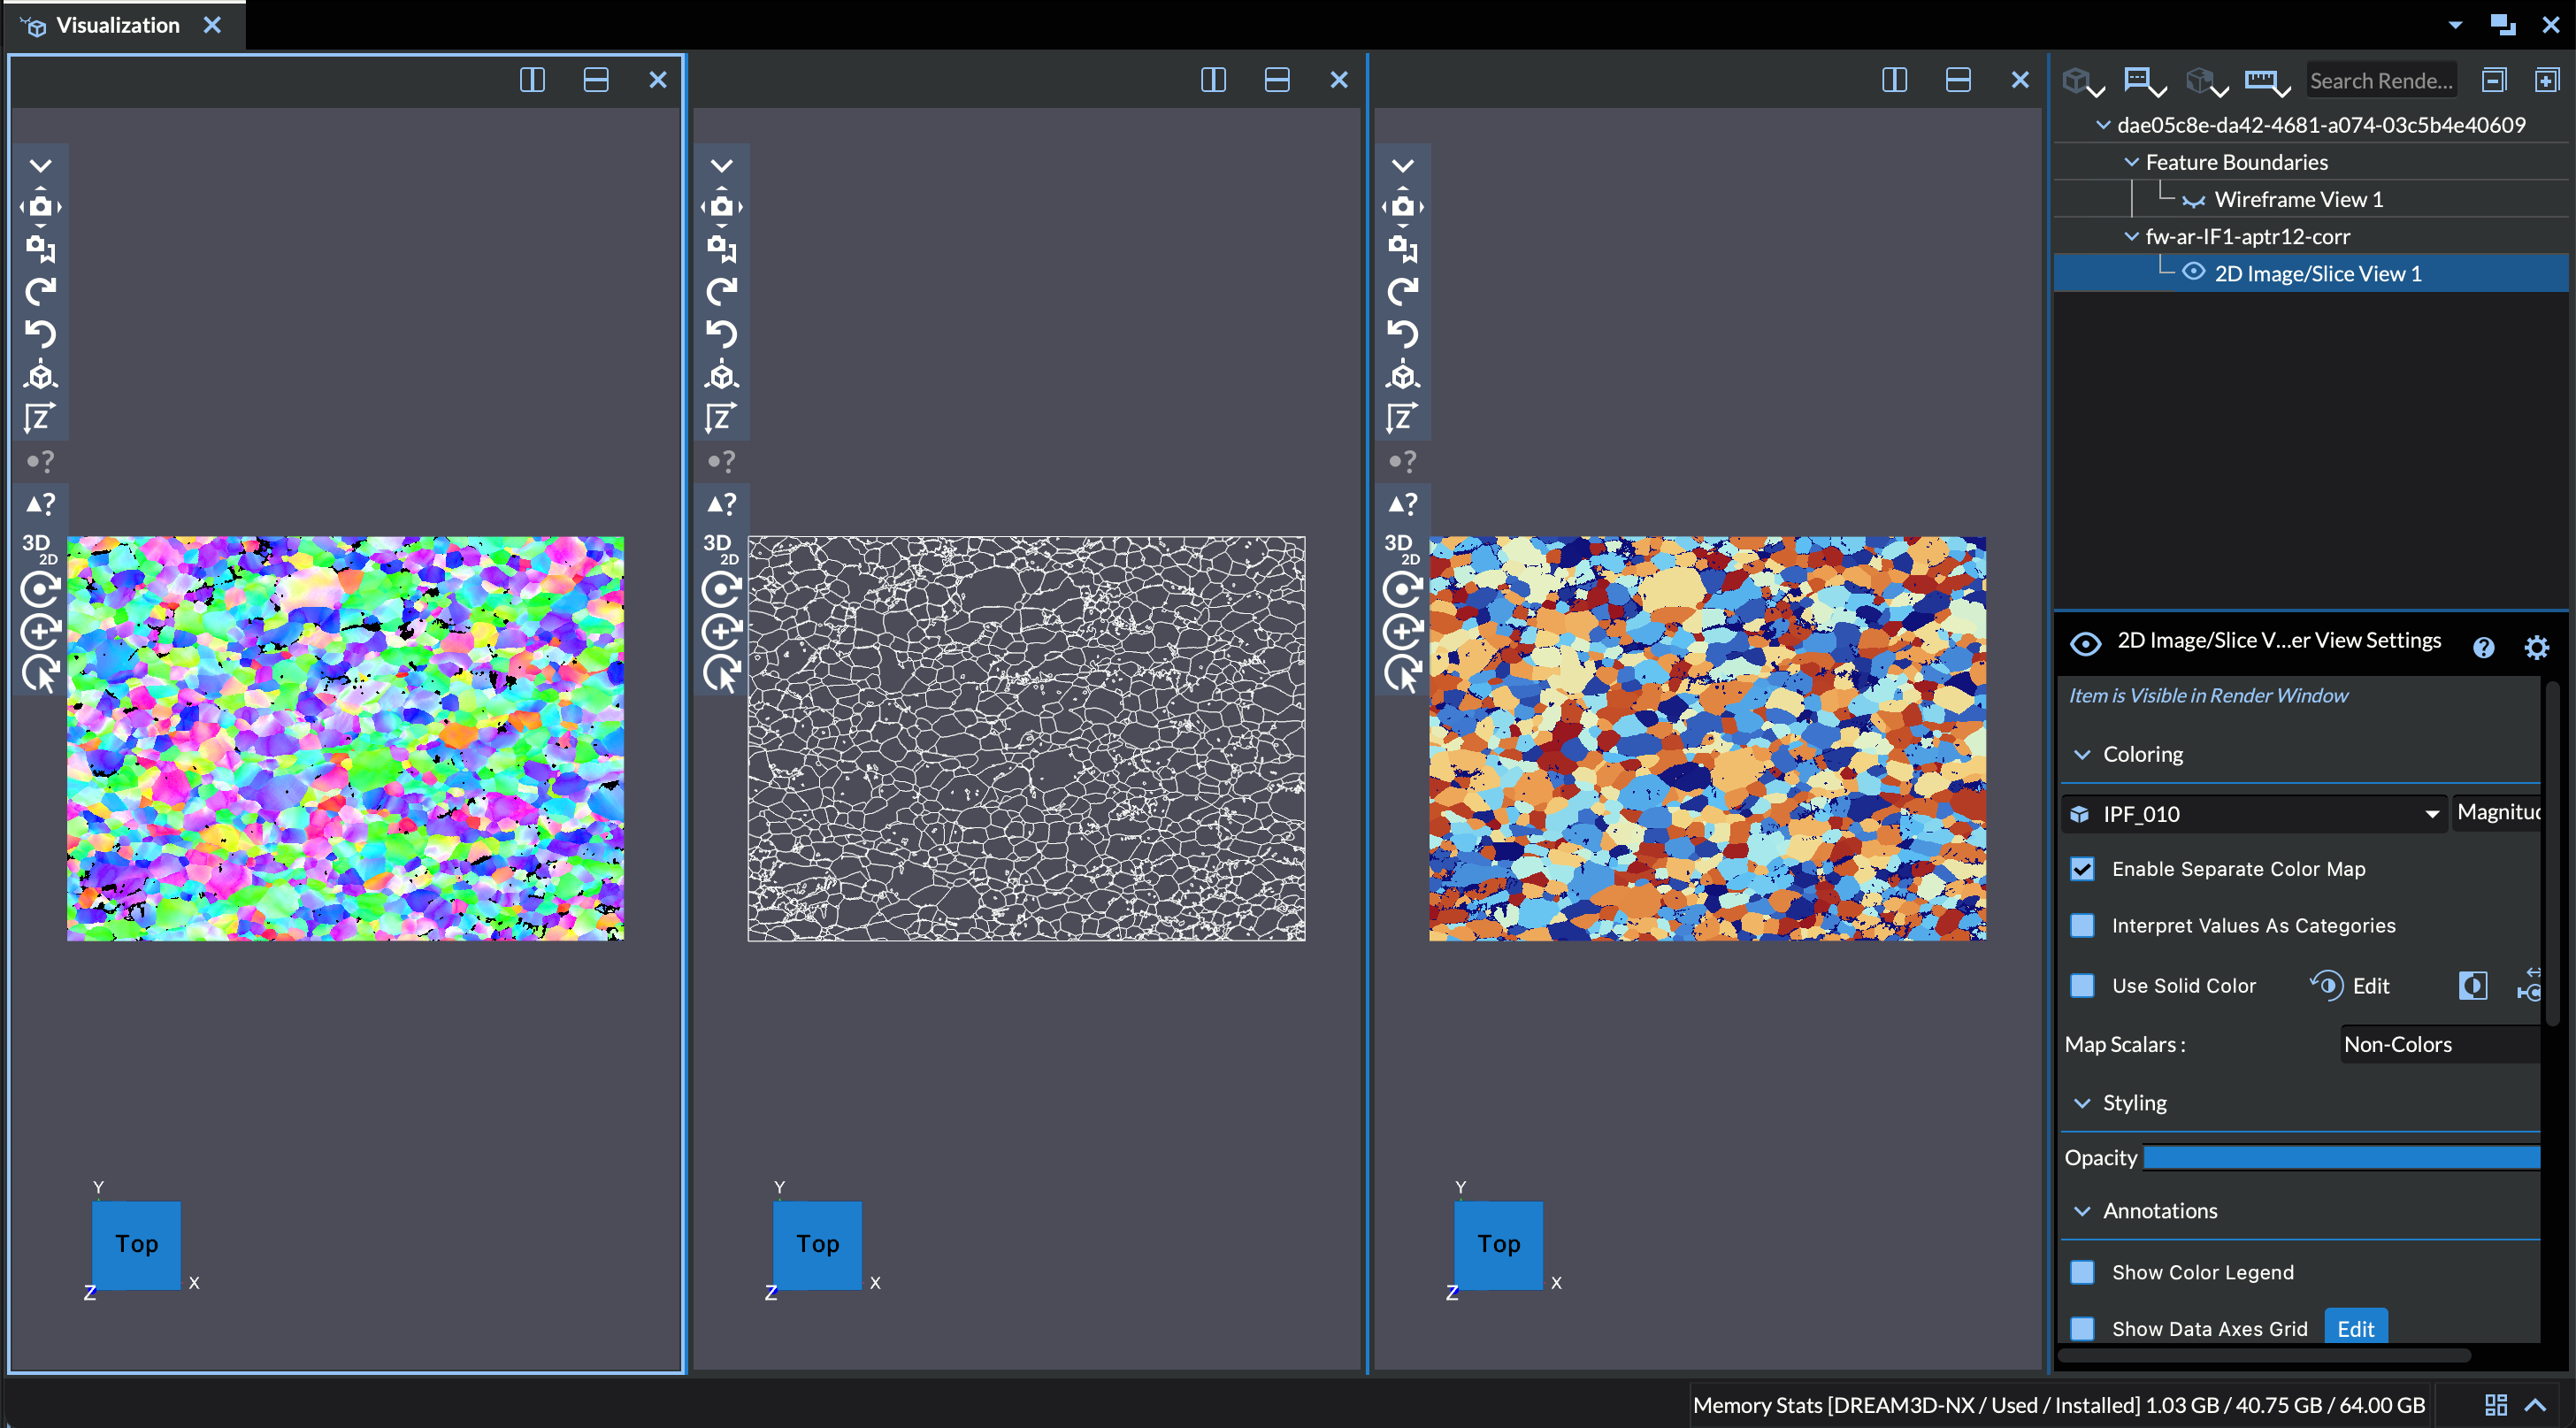
The Render Window splitting feature will create a new view and place it next to the existing one (the placement of the copy depends on whether you split horizontally or vertically). There are two options for splitting. The Render View option will create a new render window for visualization the data and the Spreadsheet View option will create a new spreadsheet view for viewing the raw data in a table format. You can split as many times as you like. You can resize the view after splitting by hovering over the space that separates two views until the mouse icon changes, then left-click and hold while dragging the mouse back and forth to reach the desired sizing. The new views will have the data hidden by default. You can turn on/show the data in the view by clicking on the view you would like the data to appear in and clicking the closed eye icon (
 )
next to the data view item in the tree until it appears
open (
)
next to the data view item in the tree until it appears
open (  ). Click the icon again to hide the data.
Before continuing, it is important to know how to identify the current view and what that means as far as the options available in the Render Properties view (located to the right of the Visualization tab by default). The current view is signified by a blue (dark theme) or orange (light theme) border. By default, there will only be one view and it will be selected as the current one. The details shown in the Render Properties view represents the data for the current Render Window. This means that if you have performed a split you can click back and forth between multiple Render Windows and the data in the Render Properties view will change to match that of the current Render Window. Additionally, if only one data view is visible in the newly selected view, it will be automatically selected in the tree and its settings panel will appear immediately (see Automatic Selection When Switching Views for details).
The Split Horizontally Button (
 ): This will put the new view horizontally next
to the current view
): This will put the new view horizontally next
to the current viewThe Split Vertically Button (
 ):
This will put the new view vertically next to
the current vi*view*ew.
):
This will put the new view vertically next to
the current vi*view*ew.The Close View Button (
 ):
This will remove the current view.
):
This will remove the current view.
Interacting with the Render Window
This section covers the basics of how to interact with the camera’s viewpoint in the Render Window. This allows users to visualize data from different angles and perspectives. There are three basic operations one can perform on the camera’s view to do this:
rotating
translating
zooming
It is important to emphasize that these operations are being performed on the camera’s viewpoint and not the data itself. Meaning when you perform a rotation, you are not rotating the geometry through space, you are rotating the camera to view the geometry from a different perspective.
Rotating the Perspective
In order to rotate the perspective, left-click and hold anywhere in the Render Window. While you are still holding the click, drag your mouse around until you find the desired perspective. You may have to perform several of these in order to reach the perspective you are looking for. You should also notice a small axis label in the bottom left hand corner of the Render Window (shown below) which will show you the orientation of your geometry with respect to each of the three x, y, and z axes.
Figure 4.8 Axes Orientation Marker
Translating the Perspective
There are two ways to perform a translation of perspective:
Click down and hold on the scroll wheel anywhere in the Render Window and while you are still holding the click drag your mouse around until you find the desired perspective.
Press and hold the shift key on your keyboard, then while you are holding the shift key left-click and hold anywhere in the Render Window. Then, while you are holding the shift key and the left-click, drag your mouse around until you find the desired perspective.
Zooming
There are two ways to perform a zoom operation:
Hover your mouse anywhere in the Render Window and use the scroll wheel to zoom in and out.
Right-click and hold anywhere in the Render Window, and while you are still holding the click drag your mouse vertically up and down to zoom in and out respectively.
Render Window Toolbar Buttons Overview
This section will go over all the buttons that can be found in the toolbars along the left hand side of the Render Window and what each of these buttons do.
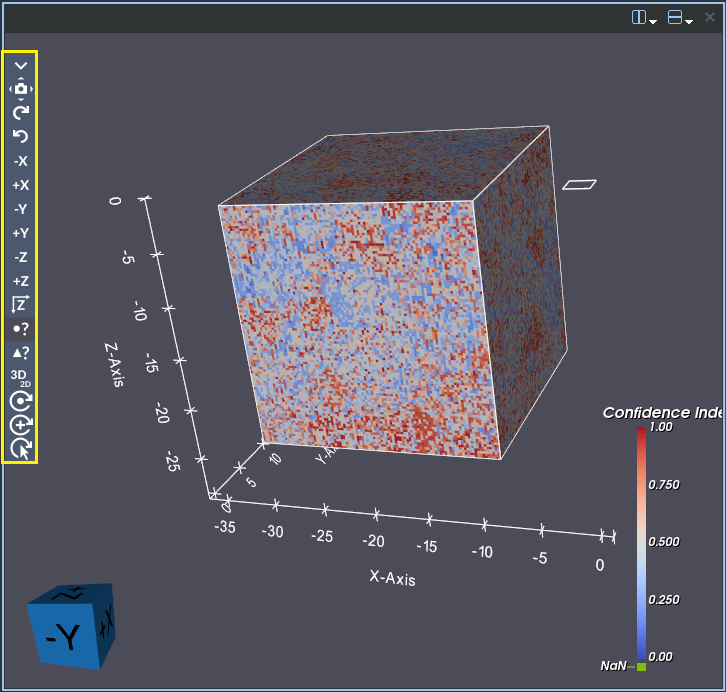
Figure 4.9 Visualization Toolbar Buttons
The Snap to Plane buttons
Reset Camera button (
 ): Resets the
camera to fit the data to the render window
): Resets the
camera to fit the data to the render windowCamera Presets button: Opens a menu from which the user can add, remove, and apply a custom camera angle/view direction
Rotate Clockwise button (
 ): Rotates the
data in the view clockwise by 90 degrees.
): Rotates the
data in the view clockwise by 90 degrees.Rotate Counterclockwise button (
 ):
Rotates the data in the view counterclockwise by 90 degrees.
):
Rotates the data in the view counterclockwise by 90 degrees.View Direction Shortcuts button: Opens a menu with the following camera view shortcuts:
X-up button (
 ): Snaps the camera view to the
positive x direction
): Snaps the camera view to the
positive x directionX-down button (
 ): Snaps the camera view to
the negative x direction
): Snaps the camera view to
the negative x directionY-up button (
 ): Snaps the camera view to the
positive y direction
): Snaps the camera view to the
positive y directionY-down button (
 ): Snaps the camera view to
the negative y direction
): Snaps the camera view to
the negative y directionZ-up button (
 ): Snaps the camera view to the
positive z direction
): Snaps the camera view to the
positive z directionZ-down button (
 ): Snaps the camera view to
the negative z direction
): Snaps the camera view to
the negative z direction
Point/Cell Hover Info :
The point (
 ) and cell (
  )
hover features allows the user to hover over points and cells in the
Render Window and display id and field data associated with them.
The hovered point/cell will be highlighted in the Render Window
and the data will be displayed in a popup window underneath the mouse.
Right or left clicking the hovered point/cell will print the details
out to the DREAM3D-NX output window and copy the details to the
clipboard in csv format.
)
hover features allows the user to hover over points and cells in the
Render Window and display id and field data associated with them.
The hovered point/cell will be highlighted in the Render Window
and the data will be displayed in a popup window underneath the mouse.
Right or left clicking the hovered point/cell will print the details
out to the DREAM3D-NX output window and copy the details to the
clipboard in csv format.The 3D/2D button (
 ) :
) :This will lock or unlock the Render Window to the current camera angle.
3D means you can rotate the camera view using the methods outlined in the Rotating the Perspective section of this page.
2D means you cannot rotate the camera view (you can however still translate and zoom using the methods outlined in the Translating the Perspective and Zooming sections of this page)
The focal point buttons
Show/Hide Focal Point button (
 ): Shows or hides
the focal point of the camera.
): Shows or hides
the focal point of the camera.Reset Focal Point button (
 ): Resets the
focal point of the camera back to the center of the bounding box of the visible data.
): Resets the
focal point of the camera back to the center of the bounding box of the visible data.Pick Focal Point button (
 ): Pick a custom focal point for the camera
Additional Features (Render Window Context Menu Options)
On top of mouse/keyboard interactions with the Render Window and the toolbar buttons described in the previous sections, there are also a number of additional features that are available via a Context Menu in the Render Window. You can access this menu by right-clicking anywhere in the Render Window.
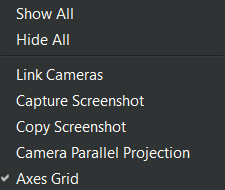
Figure 4.10 Basic Render Window Context Menu Options
General Context Menu Options
The following options are available via the context menu in the Render Window and are independent of any geometries being displayed.
Note
The screenshot below shows the updated context menu layout. If your menu looks different, your application may be running an older version.
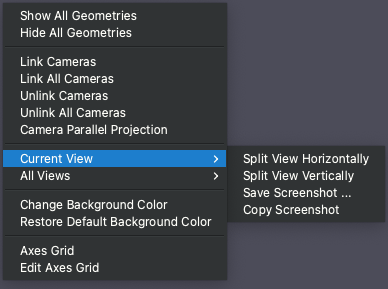
Figure 4.11 Updated context menu showing all camera, view, and screenshot options.
Link Cameras :
This feature allows you to link the cameras from two specific Render Windows so that any changes to the camera made in one will also happen to the camera in the other. To activate this feature, select the Link Cameras option from the Context Menu in one of the Render Windows you wish to link. Then left-click in the other Render Window you wish to link. The cameras in these two Render Windows should now be in sync. To unlink the cameras, right-click again in either of the two linked Render Windows and click the Unlink Cameras option.
Note
Link Cameras links exactly two windows at a time. To link all open windows simultaneously, use Link All Cameras below.
Link All Cameras :
This feature links all open Render Windows together in a single click, so that navigating in any one window (rotating, panning, or zooming) is immediately reflected in every other window. This is useful when comparing results side-by-side and you want all views to stay in sync without linking each pair individually.
To activate, right-click anywhere in any Render Window and select Link All Cameras from the context menu. All currently open windows will share the same camera viewpoint from that point on.
Note
Link All Cameras requires at least two open Render Windows to have any visible effect. Newly split windows created after linking are automatically included in the linked group.
Unlink Cameras :
Unlinks this Render Window from the camera it is currently paired with via Link Cameras, restoring it to an independent viewpoint. This option is only visible when the current window is linked to another window.
Unlink All Cameras :
Restores every open Render Window to its own independent camera in a single click, regardless of how many windows are currently linked. This option is only visible when the current window is part of a linked group.
Camera Parallel Projection :
Toggling this option determines whether the camera uses parallel (orthographic) or perspective (default) projection.
Current View submenu :
The Current View submenu groups actions that apply only to the Render Window from which the context menu was opened.
Split Horizontally : Creates a new view and places it horizontally next to the existing one. For more details see Render Window Splitting under the Visualization View Interaction Toolbar section above.
Split Vertically : Creates a new view and places it vertically next to the existing one. For more details see Render Window Splitting under the Visualization View Interaction Toolbar section above.
Save Screenshot … :
Takes a screenshot of the current Render Window and saves it to an image file. After selecting the save path, a dialog lets you choose a background for the image. Check the checkbox to save with a transparent background, or click Background Color to choose a custom solid color. The selected color is previewed in the circle beside the button. Supported formats are PNG, JPEG, and BMP; only PNG is available when transparent background is selected.
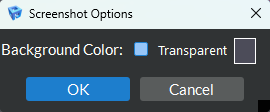
Figure 4.12 Screenshot Options dialog.
Copy Screenshot :
Takes a screenshot of the current Render Window and copies it directly to the clipboard. This is convenient for quickly pasting results into documents or emails. Transparent background is not supported for clipboard copies.
Save Screenshot of All Views … :
Composites all visible VTK Render Windows into a single tiled image and saves it to file. The same background-color / transparency dialog appears as for Save Screenshot … above. The composite image is assembled at the native physical pixel resolution, so HiDPI / Retina displays produce full-resolution output. Supported formats are PNG, JPEG, and BMP; only PNG is available when a transparent background is selected.
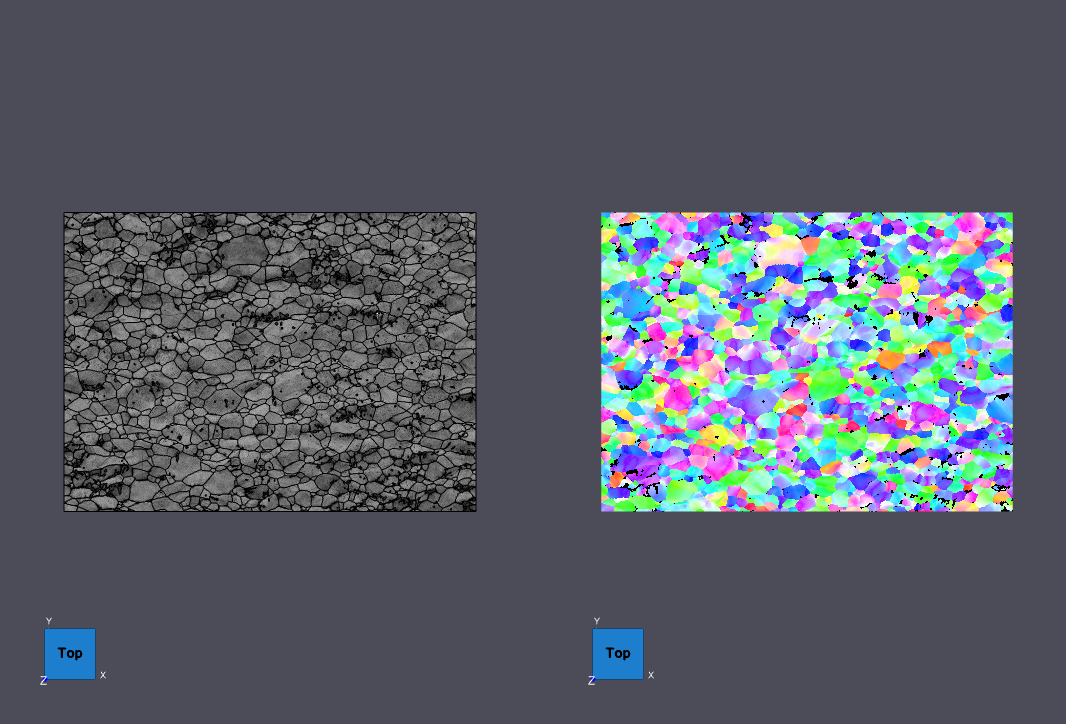
Figure 4.13 Multiview Screenshot.
Copy All Views to Clipboard :
Composites all visible VTK Render Windows into a single tiled image and copies it directly to the clipboard — no file dialog or background-color prompt is shown. Each panel uses its own renderer background color. This option is convenient for quickly pasting a multi-panel result into a document or email without saving to disk. Transparent background is not supported for clipboard copies.
All Views → Equalize Views submenu :
The Equalize Views submenu contains two options for redistributing the sizes of all Render Windows so that every view occupies an equal share of the available space. This is particularly useful after manually resizing views by dragging the divider handles and wanting to quickly return to a balanced layout.
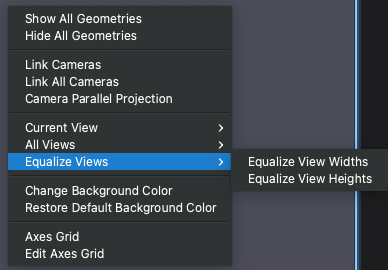
Figure 4.14 The All Views submenu showing the Equalize Views sub-menu. Capture with a split-view layout open so the menu is not greyed out.
Equalize View Widths : Resizes all columns of Render Windows so that each column occupies an equal fraction of the total width.
Equalize View Heights : Resizes all rows of Render Windows so that each row occupies an equal fraction of the total height.
Note
If you have only a single Render Window open, these options have no visible effect. Use Split Horizontally or Split Vertically first to create multiple views.
Change Background Color :
This feature allows you to change the current Render Window’s background color.
Restore Default Background Color :
Restores the current Render Window’s background color to the application default set in the application preferences.
Axes Grid :
This option will turn on/off an axes grid label for all geometries currently being shown in the Render Window. This option is NOT the same as the Data Axes Grid option found in the Render Properties tab. Notes: If you only have one geometry showing in the Render Window, the two will coincide. Also if you have any Volume data views near any of the borders of the bounding box for all the geometries then depending on how you define the opacity function for the active array on that representation, the full dataset bounds may not be visible and therefore the grid axes may seem offset from what is actually rendered.
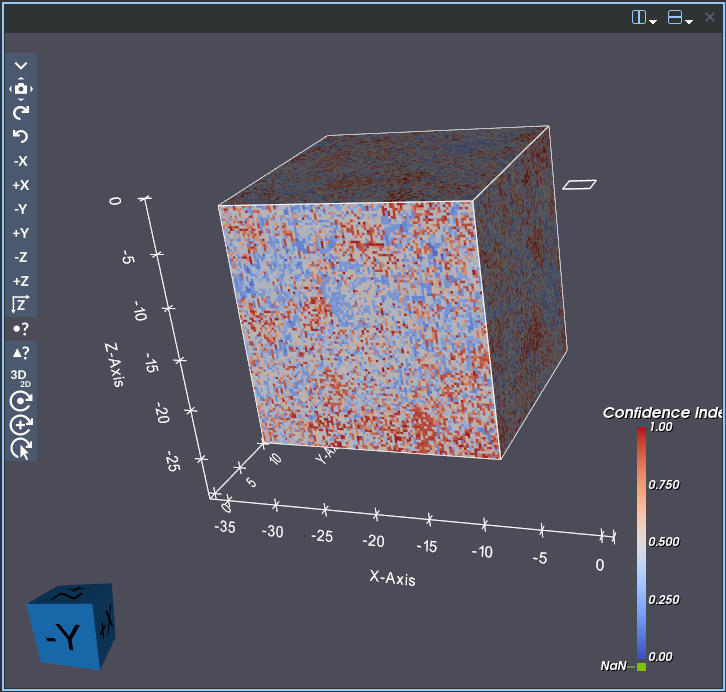
Figure 4.15 Global Grid Axes
Edit Axes Grid :
This option opens a dialog to allow editing the tick mark spacing and grid lines visibility for the global data axes grid
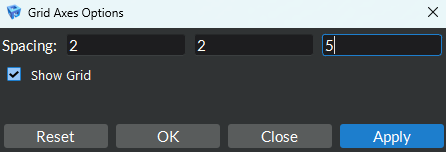
Figure 4.16 Edit Global Grid Axes