A DREAM3D-NX state file (.d3dstate) is a file that saves the entire state of single DREAM3D-NX pipeline window. This includes the state/layout of the (current) pipeline window (i.e. where overything is docked and layed out),
whether or not it is in workflow mode, the pipeline, the state of visualization (including the render window splitview layout, the pipeline browser tree, and all of the render properties for each item),
and the state of charting (including the splitview layout, all the charts and their properties).
Before saving the state to a DREAM3D-NX state file, there are a few important caveats to make note of;
The state files will not save any visualization camera linking currently set between render window splits
The geometries loaded in visualization and charting must be saved to an associated supported file type in order to save the visualization state. (When charting or visualizing data
from a pipeline, the easiest way to ensure this is by adding a Write DREAM3D NX Filter to the end of your pipeline).
If the visualization or charting components are not in a valid state for saving, the application will simply skip over the invalid components when saving the state.
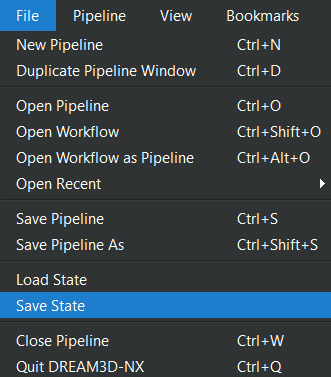
Once you have a valid state for saving, you can create a state file by selecting the Save State option from the File menu bar menu.
Before loading a state file, it is important to note that the current split
view settings for the visualization and charting components will be cleared
and any data currently loaded might be deleted. There are a couple of different ways
in which to load a state file into DREAM3D-NX:
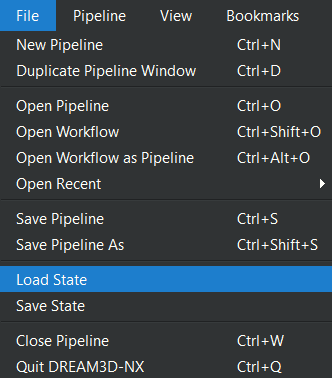
Via the File Menu. Go to the File menu bar menu and select the Load State option.
By dragging and dropping the state file. Find the state file you wish to load, then drag
and drop it into a DREAM3D-NX pipeline area, charting area, or visualization area.