12.32. Generate and Write Pole Figure Images
Group (Subgroup)
IO (Output)
Description
This filter creates standard crystallographic pole figure images, one set per Ensemble (phase) present in the data. A pole figure is a 2D circular plot that maps selected 3D crystal-orientation directions onto a flat disk, making it easy to see whether a material has a preferred orientation (texture) or is randomly oriented. This filter produces pole figures for the <001>, <011>, and <111> crystal directions.
The filter reads Euler angles (in radians, Bunge Z-X-Z convention) describing the orientation of each cell, the phase each cell belongs to, and per-phase crystal-structure information. An optional Mask array can exclude non-indexed or invalid points from the plot.
How the Pole Figure Is Drawn
Two rendering methods are available through the Pole Figure Type parameter:
Color Intensity [0]: Produces a continuous color intensity map. To do this the filter accumulates orientation counts onto a modified Lambert square – an equal-area grid laid over a square that can be folded onto a hemisphere – and interpolates that grid onto the unit circle. This is a Lambert (equal-area) projection. EBSD OEM software does not use this exact interpolation, so the output may look slightly different from an OEM-generated pole figure.
Discrete [1]: Produces a point-based plot, drawing a small filled circle at each projected orientation. The circle size is controlled by the Discrete Marker Radius (Pixels) parameter so markers stay visible at any image size (legacy DREAM3D marked each hit as a single pixel). This uses a stereographic projection, the classic pole-figure projection that maps directions from a sphere onto a plane while preserving angles.
The crystal symmetry used when folding orientations into the pole figure is determined by each phase’s Laue Class – the point-group symmetry class of the crystal (for example, cubic m-3m or hexagonal 6/mmm). The Laue Class is looked up from the per-Ensemble Crystal Structures array.
Only an advanced user with intimate knowledge of the modified Lambert projection should change the Lambert Image Size (Pixels) parameter. This value is the height/width, in pixels, of the internal Lambert square used for interpolation.
Reference Frame Conventions (Matching EDAX OIM and MTEX)
This filter plots orientations exactly as they are stored in the Euler Angles array; it applies no reference-frame correction of its own. A pole figure depends only on the orientations, never on the physical location of the Cell each orientation came from.
This matters when comparing the output to other tools. TSL/EDAX .ang files record the Euler angles and the spatial scan coordinates in two different reference frames that are offset by a fixed rotation. EDAX OIM Analysis and the MTEX toolbox display pole figures in the corrected (spatial) frame, so their pole figures appear rotated relative to the uncorrected orientations this filter receives. With no correction applied, this filter’s output is consistent with MTEX loaded without convertEuler2SpatialReferenceFrame.
To make a pole figure match EDAX OIM or MTEX, apply the Rotate Euler Reference Frame filter to the Euler Angles before this filter. The Rotate Sample Reference Frame filter only relocates Cells in space and leaves orientation values unchanged, so it has no effect on a pole figure.
The correction is a single 180° rotation; the axis selects the convention. Each axis below reproduces the correspondingly numbered MTEX convertEuler2SpatialReferenceFrame “setting”, entered into Rotate Euler Reference Frame as a normalized axis and an angle of 180 degrees:
Rotation Axis |
Angle |
MTEX setting |
Notes |
|---|---|---|---|
(0.7071067812, 0.7071067812, 0) |
180° |
setting 1 |
|
(0.7071067812, -0.7071067812, 0) |
180° |
setting 2 |
EDAX/TSL default – matches EDAX OIM |
(1, 0, 0) |
180° |
setting 3 |
|
(0, 1, 0) |
180° |
setting 4 |
For data read from Read EDAX EBSD Data (.ang), use the (0.7071067812, -0.7071067812, 0), 180° rotation. Apply the correction only once; do not also correct upstream if it has already been applied.
The Hex/Trig Cartesian Basis Convention parameter (x||a or x||a*) is a separate setting. It selects how the hexagonal/trigonal crystal basis is aligned to Cartesian axes and shifts the prismatic <011> and <111> pole positions by 30°; it does not affect the basal <001> pole figure. Use x||a to match the EDAX/TSL and legacy DREAM3D convention.
Required Input Sources
Euler Angles and Phases – per-cell orientation and phase data, typically read from EBSD data via Read H5EBSD File, Read EDAX EBSD Data (.ang), or Read Oxford Instr. EBSD Data (.ctf).
Crystal Structures (per-Ensemble, used to derive each phase’s Laue Class) and Material Name – created as part of the Ensemble data by the same EBSD reader.
Mask (optional) – a per-cell boolean array marking valid points, produced by Multi-Threshold Objects. Enable Use Mask Array to apply it.
Output Options
Write Image to Disk
When Write Pole Figure as Image is enabled, the combined set of pole figures is written to disk as a PNG image file, one file per phase, in the selected output directory.
Save Pole Figure as Image Geometry
When Save Output as Image Geometry is enabled, the combined pole-figure image is stored in the DataStructure as an Image Geometry so it can be viewed inside DREAM3D-NX.
Save Count Data Arrays
When Save Count Images is enabled, the per-direction count data for each pole figure is stored as a Data Array inside an Image Geometry, allowing custom color plots to be made later. A string Data Array is also stored that records the metadata used to build each plot (number of points, hemisphere, phase name, etc.). When Normalize Count Data to MRD is enabled, the counts are normalized to multiples of a random distribution (MRD), where 1.0 means “as common as a random arrangement.”
Image Size
The Image Size (Square Pixels) parameter sets the height and width, in pixels, of each individual pole figure in the output image.
Image Layout
The Image Layout parameter controls how the pole figures are arranged in the output image. Supporting information (including the color bar legend for color pole figures) is also drawn on the image.
Colorized Intensity |
Discrete |
|---|---|
|
|
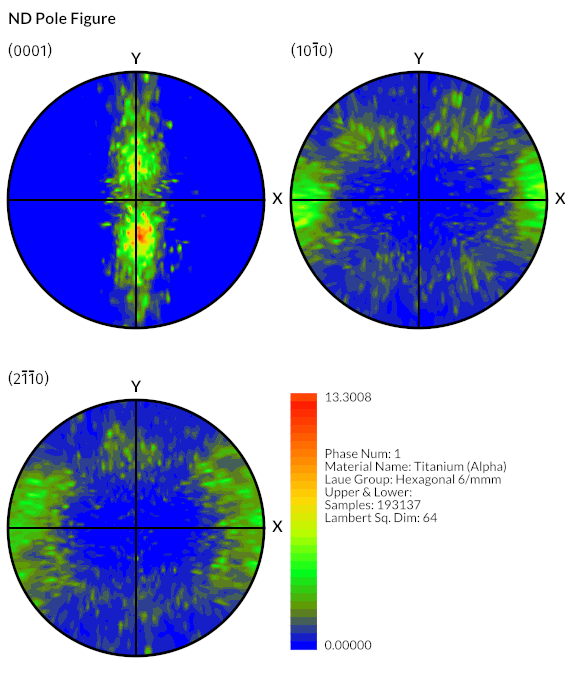
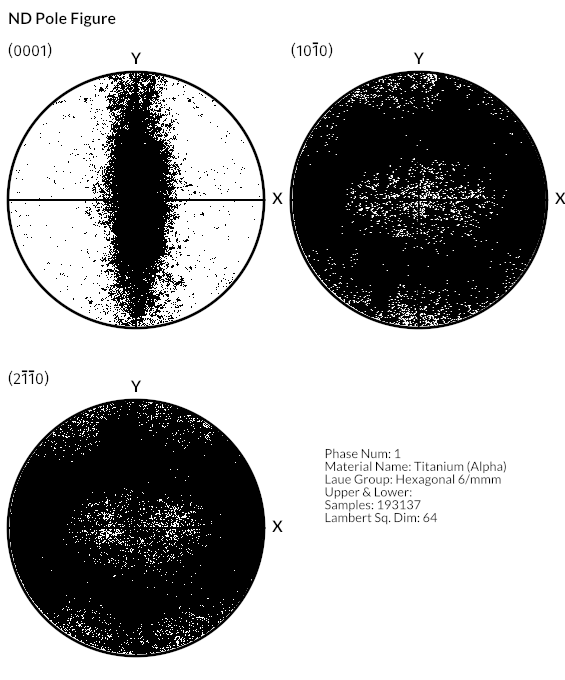
The available layout choices are:
Horizontal [0]: Pole figures are arranged in a single horizontal row.
Vertical [1]: Pole figures are arranged in a single vertical column.
Square [2]: Pole figures are arranged in a square grid.
Input Parameter(s)
Parameter Name |
Parameter Type |
Parameter Notes |
Description |
|---|---|---|---|
Figure Title |
String |
The title to place at the top of the Pole Figure |
|
Image Size (Square Pixels) |
Scalar Value |
Int32 |
The number of pixels that define the height and width of each output pole figure |
Image Layout |
Choices |
How to layout the 3 pole figures. 0=Horizontal, 1=Vertical, 2=Square |
|
Pole Figure Type |
Choices |
The type of pole figure generated. 0=Color, 1=Discrete |
|
Lambert Image Size (Pixels) |
Scalar Value |
Int32 |
The height/width of the internal Lambert Square that is used for interpolation |
Number of Colors |
Scalar Value |
Int32 |
The number of colors to use for the Color Intensity pole figures |
Discrete Marker Radius (Pixels) |
Scalar Value |
Int32 |
Radius of each discrete pole marker. Only used for the Discrete pole figure type. |
Hex/Trig Cartesian Basis Convention |
Choices |
Cartesian basis used for hex/trigonal phases. Pole-figure positions and corner labels are rotated 30° about the c-axis between the two: |
|
X parallel to a: EDAX/TSL/OIM Analysis convention. This is the convention every released DREAM.3D / DREAM3DNX / SIMPL / SIMPLNX file stores hex/trig EulerAngles in. |
|||
X parallel to a*: MTEX / Oxford Channel 5 / AZtec convention. Pick this for apples-to-apples comparison against MTEX-produced pole figures. |
|||
Cubic, tetragonal, orthorhombic, monoclinic, and triclinic phases ignore this setting. |
Input Orientation Data
Parameter Name |
Parameter Type |
Parameter Notes |
Description |
|---|---|---|---|
Euler Angles |
Array Selection |
Allowed Types: float32 Comp. Shape: 3 |
Three angles defining the orientation of the Element in Bunge convention (Z-X-Z) |
Phases |
Array Selection |
Allowed Types: int32 Comp. Shape: 1 |
Specifies to which Ensemble each Euler angle belongs |
Optional Data Mask
Parameter Name |
Parameter Type |
Parameter Notes |
Description |
|---|---|---|---|
Use Mask Array |
Bool |
Should the algorithm use a mask array to remove non-indexed points |
|
Mask Array |
Array Selection |
Allowed Types: uint8, boolean Comp. Shape: 1 |
DataPath to the input Mask DataArray |
Input Ensemble Data
Parameter Name |
Parameter Type |
Parameter Notes |
Description |
|---|---|---|---|
Crystal Structures |
Array Selection |
Allowed Types: uint32 Comp. Shape: 1 |
Enumeration representing the crystal structure for each Ensemble |
Material Name |
DataPathSelection |
DataPath to the input DataArray that holds the material names |
Output Image File
Parameter Name |
Parameter Type |
Parameter Notes |
Description |
|---|---|---|---|
Write Pole Figure as Image |
Bool |
Should the filter write the pole figure plots to a file. |
|
Output Directory Path |
FileSystemPath |
This is the path to the directory where the pole figures will be created. One file for each phase. |
|
Pole Figure File Prefix |
String |
The prefix to apply to each generated pole figure. Each Phase will have its own pole figure. |
Output Image Geometry
Parameter Name |
Parameter Type |
Parameter Notes |
Description |
|---|---|---|---|
Save Output as Image Geometry |
Bool |
Save the generated pole figure as an ImageGeometry |
|
Output Image Geometry |
DataGroupCreation |
The path to the created Image Geometry |
Output Count Data Arrays
Parameter Name |
Parameter Type |
Parameter Notes |
Description |
|---|---|---|---|
Save Count Images |
Bool |
Save the Count Plots (x3) |
|
Output Count Image Geometry |
DataGroupCreation |
The path to the created Count Image Geometries |
|
Normalize Count Data to MRD |
Bool |
The Pole Figure data should be normalized to MRD values |
|
Count Plot 1 |
DataObjectName |
The counts data for the plot |
|
Count Plot 2 |
DataObjectName |
The counts data for the plot |
|
Count Plot 3 |
DataObjectName |
The counts data for the plot |
Example Pipelines
TxCopper_Exposed
TxCopper_Unexposed
License & Copyright
Please see the description file distributed with this Plugin
DREAM3D-NX Help
If you need help, need to file a bug report or want to request a new feature, please head over to the DREAM3DNX-Issues GitHub site where the community of DREAM3D-NX users can help answer your questions.